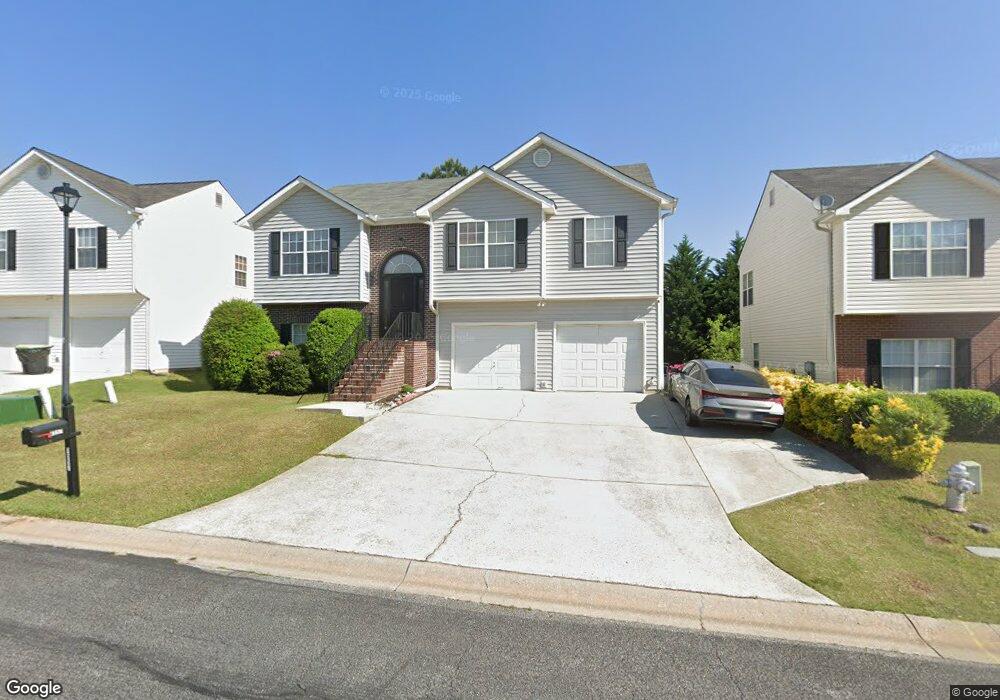
1557 Willow Wood Trace Unit 1 Atlanta, GA 30349
Estimated Value: $250,000 - $271,000
4
Beds
3
Baths
1,994
Sq Ft
$132/Sq Ft
Est. Value
About This Home
This home is located at 1557 Willow Wood Trace Unit 1, Atlanta, GA 30349 and is currently estimated at $263,806, approximately $132 per square foot. 1557 Willow Wood Trace Unit 1 is a home located in Clayton County with nearby schools including Martin Luther King- Jr. Elementary School, North Clayton Middle School, and North Clayton High School.
Ownership History
Date
Name
Owned For
Owner Type
Purchase Details
Closed on
May 30, 2024
Sold by
Goodloe-Vintes Twana S
Bought by
Goodloe Vintes Twana and Vintes Twana Goodloe
Current Estimated Value
Purchase Details
Closed on
Nov 5, 2010
Sold by
Goodloe Twana S
Bought by
Goodloe-Vintes Twana S
Home Financials for this Owner
Home Financials are based on the most recent Mortgage that was taken out on this home.
Original Mortgage
$122,700
Interest Rate
4.5%
Mortgage Type
FHA
Purchase Details
Closed on
Oct 31, 2000
Sold by
Multi Specs Inc
Bought by
Goodloe Twana S
Home Financials for this Owner
Home Financials are based on the most recent Mortgage that was taken out on this home.
Original Mortgage
$128,205
Interest Rate
7.94%
Mortgage Type
FHA
Create a Home Valuation Report for This Property
The Home Valuation Report is an in-depth analysis detailing your home's value as well as a comparison with similar homes in the area
Home Values in the Area
Average Home Value in this Area
Purchase History
| Date | Buyer | Sale Price | Title Company |
|---|---|---|---|
| Goodloe Vintes Twana | -- | -- | |
| Goodloe-Vintes Twana S | -- | -- | |
| Goodloe Twana S | $129,900 | -- |
Source: Public Records
Mortgage History
| Date | Status | Borrower | Loan Amount |
|---|---|---|---|
| Previous Owner | Goodloe-Vintes Twana S | $122,700 | |
| Previous Owner | Goodloe Twana S | $128,205 |
Source: Public Records
Tax History Compared to Growth
Tax History
| Year | Tax Paid | Tax Assessment Tax Assessment Total Assessment is a certain percentage of the fair market value that is determined by local assessors to be the total taxable value of land and additions on the property. | Land | Improvement |
|---|---|---|---|---|
| 2024 | $3,683 | $103,440 | $8,000 | $95,440 |
| 2023 | $3,774 | $104,520 | $8,000 | $96,520 |
| 2022 | $2,090 | $62,280 | $8,000 | $54,280 |
| 2021 | $1,997 | $59,600 | $8,000 | $51,600 |
| 2020 | $1,638 | $49,994 | $8,000 | $41,994 |
| 2019 | $1,607 | $48,656 | $6,200 | $42,456 |
| 2018 | $1,608 | $48,673 | $6,200 | $42,473 |
| 2017 | $1,374 | $42,828 | $6,200 | $36,628 |
| 2016 | $908 | $31,382 | $6,200 | $25,182 |
| 2015 | $905 | $0 | $0 | $0 |
| 2014 | $805 | $29,255 | $6,200 | $23,055 |
Source: Public Records
Map
Nearby Homes
- 1618 Blossom Dr
- 5937 Yellowood Ct
- 1417 Pineglen Dr
- 1410 Willow Dr
- 1460 Flat Shoals Rd
- 6080 Camden Forrest Cove
- 1386 Pineglen Dr
- 6105 E Fayetteville Dr
- 5827 Highgrove Dr
- 5668 Williamsburg Trace
- 6120 E Fayetteville Dr
- 5738 Antelope Trail
- 1349 Heather Cir
- 1967 Highgrove Ct
- 5768 Grande River Rd
- 5806 Highgrove Dr
- 6076 Camden Forrest Dr
- 1563 Willow Wood Trace
- 1551 Willow Wood Trace
- 6100 Yellowood Ct
- 6097 Yellowood Ct
- 5944 Sugar Maple Ct
- 5944 Sugar Maple Ct Unit 5944
- 1569 Willow Wood Trace
- 6106 Yellowood Ct
- 6105 Yellowood Ct
- 1560 Willow Wood Trace
- 1552 Willow Wood Trace
- 5938 Sugar Maple Ct Unit I
- 1566 Willow Wood Trace
- 0 Sugar Maple Ct Unit 7415722
- 0 Sugar Maple Ct Unit 7311007
- 0 Sugar Maple Ct
- 6112 Yellowood Ct
- 6115 Yellowood Ct
- 1572 Willow Wood Trace
- 6050 Yellowood Ct