15579 Christopher Ct Unit 17 Clinton Township, MI 48035
Estimated Value: $232,807 - $263,000
2
Beds
2
Baths
1,189
Sq Ft
$208/Sq Ft
Est. Value
About This Home
This home is located at 15579 Christopher Ct Unit 17, Clinton Township, MI 48035 and is currently estimated at $247,202, approximately $207 per square foot. 15579 Christopher Ct Unit 17 is a home located in Macomb County with nearby schools including Salk Elementary School, Richards Middle School, and Fraser High School.
Ownership History
Date
Name
Owned For
Owner Type
Purchase Details
Closed on
Feb 5, 2020
Sold by
Kortas Michael C and Kortas Diane M
Bought by
Kortas Michael C and Kortas Diane M
Current Estimated Value
Purchase Details
Closed on
Jun 1, 2018
Sold by
Eileen M Percy Living Trust
Bought by
Kortas Michael C and Kortas Diane M
Home Financials for this Owner
Home Financials are based on the most recent Mortgage that was taken out on this home.
Original Mortgage
$128,000
Interest Rate
4.5%
Mortgage Type
New Conventional
Purchase Details
Closed on
Aug 16, 2008
Sold by
Percy Eileen M
Bought by
Percy Eileen M and Eileen M Percy Living Trust
Purchase Details
Closed on
Nov 8, 2006
Sold by
Geiser Michael L and Geiser James G
Bought by
Percy Eileen M
Purchase Details
Closed on
Dec 28, 1995
Sold by
Prtnsp Kings Forest
Bought by
Geiser M
Create a Home Valuation Report for This Property
The Home Valuation Report is an in-depth analysis detailing your home's value as well as a comparison with similar homes in the area
Home Values in the Area
Average Home Value in this Area
Purchase History
| Date | Buyer | Sale Price | Title Company |
|---|---|---|---|
| Kortas Michael C | -- | None Available | |
| Kortas Michael C | $164,900 | Title Express Llc | |
| Percy Eileen M | -- | None Available | |
| Percy Eileen M | $168,000 | Chirco Title Company | |
| Geiser M | $113,230 | -- |
Source: Public Records
Mortgage History
| Date | Status | Borrower | Loan Amount |
|---|---|---|---|
| Previous Owner | Kortas Michael C | $128,000 |
Source: Public Records
Tax History Compared to Growth
Tax History
| Year | Tax Paid | Tax Assessment Tax Assessment Total Assessment is a certain percentage of the fair market value that is determined by local assessors to be the total taxable value of land and additions on the property. | Land | Improvement |
|---|---|---|---|---|
| 2025 | $3,578 | $107,400 | $0 | $0 |
| 2024 | $2,073 | $103,200 | $0 | $0 |
| 2023 | $1,966 | $93,800 | $0 | $0 |
| 2022 | $3,242 | $90,000 | $0 | $0 |
| 2021 | $3,153 | $86,300 | $0 | $0 |
| 2020 | $1,805 | $81,400 | $0 | $0 |
| 2019 | $2,933 | $75,100 | $0 | $0 |
| 2018 | $1,792 | $70,700 | $0 | $0 |
| 2017 | $1,776 | $62,400 | $12,500 | $49,900 |
| 2016 | $1,765 | $62,400 | $0 | $0 |
| 2015 | -- | $54,200 | $0 | $0 |
| 2014 | -- | $45,200 | $0 | $0 |
| 2011 | -- | $51,700 | $0 | $51,700 |
Source: Public Records
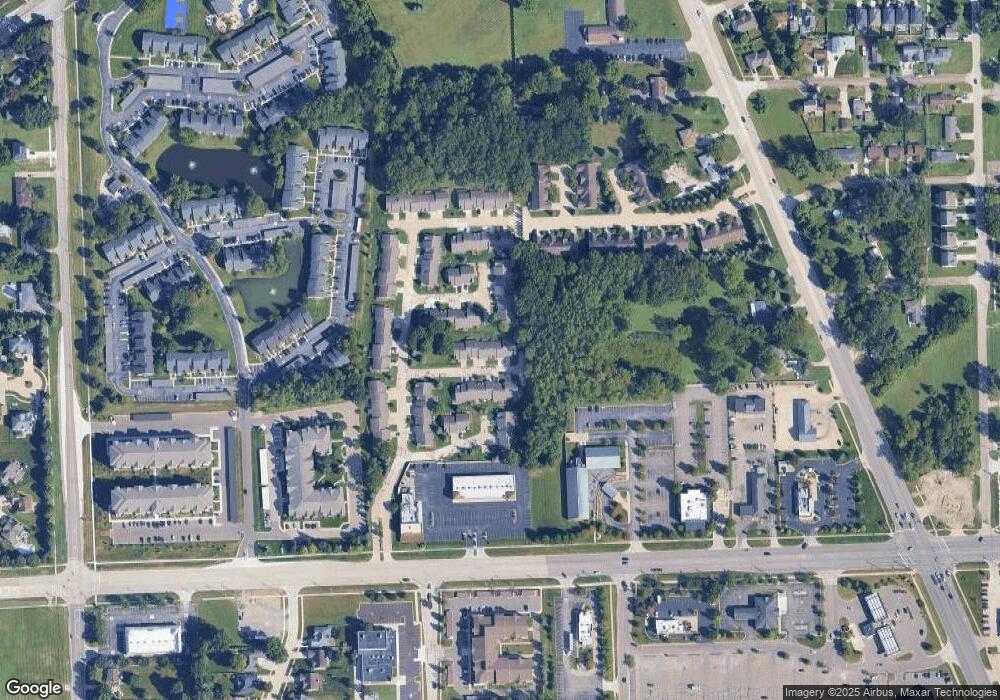
Map
Nearby Homes
- 15568 Austin Ave Unit 44
- 35251 Kings Forest Blvd Unit 62
- 35152 Kings Forest Blvd
- 35907 Fierimonte Dr Unit 4
- 15170 15 Mile Rd
- 35260 Silver Maple Dr Unit 21
- 35249 Wagner Dr
- 16143 Clarkson Dr Unit 2
- 35604 Alta Vista Dr
- 35839 Bella Sera Dr Unit 11
- 16160 Clarkson Dr
- 34642 Giannetti Dr
- 15851 Horseshoe Path Ct
- 35238 Moravian Dr
- 34894 Mercer Unit 9
- 34900 Mercer Unit 10
- 35408 Grayfield Dr
- 36334 Genuine Risk Ct
- 0 Utica Unit 50192922
- 14650 Edshire Dr
- 15549 Christopher Ct Unit 20
- 15569 Christopher Ct Unit 18
- 15589 Christopher Ct
- 15589 Christopher Ct Unit 5-16
- 15559 Christopher Ct
- 15566 Christopher Ct Unit 13
- 15566 Christopher Ct
- 15566 Christopher Ct Unit 4 13
- 15586 Christopher Ct
- 15576 Christopher Ct
- 15546 Christopher Ct
- 15530 Caputo Ct
- 15560 Caputo Ct
- 15550 Caputo Ct Unit 29
- 15540 Caputo Ct Unit 28
- 15520 Caputo Ct
- 35188 Kings Forest Blvd
- 15563 Caputo Ct
- 15573 Caputo Ct Unit 34
- 15583 Caputo Ct