1558 Cherry Hill Rd SW Conyers, GA 30094
About This Home
COMING SOON
This home is coming soon. Please check to see the estimated availability date.
Monthly Recurring Fees:
$10.95 - Utility Management
Maymont Homes is committed to clear and upfront pricing. In addition to the advertised rent, residents may have monthly fees, including a $10.95 utility management fee, a $25.00 wastewater fee for homes on septic systems, and an amenity fee for homes with smart home technology, valet trash, or other community amenities. This does not include utilities or optional fees, including but not limited to pet fees and renter’s insurance.
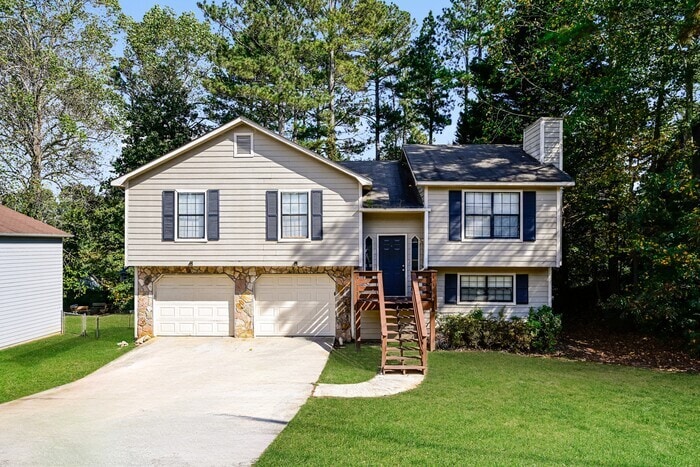
Welcome to this charming 3-bedroom, 2-bath home in Conyers, GA, offering a comfortable layout and a blend of warmth and functionality. With a two-car garage and a tree-lined backyard, this property provides both convenience and a touch of nature.
Inside, fresh interior paint in neutral tones gives the home a clean, refreshed feel. The den features brand-new carpet, offering a cozy and versatile space for relaxation or work. The living room also includes soft carpeting and plenty of natural light, creating a warm and inviting atmosphere.
The kitchen stands out with crisp white upper and lower cabinets, matching appliances, and ample counter space for everyday cooking. Sliding glass doors off the kitchen lead to a vaulted deck overlooking the backyard, perfect for enjoying the outdoors or hosting casual gatherings.
Each bedroom features cozy carpet flooring and generous natural light that enhances the home’s welcoming ambiance.
Located near multiple large shopping centers, including Lowe’s and Target, and close to gyms, restaurants, and other conveniences, this Conyers home combines comfort, practicality, and a great location.
Apply today and make this inviting home yours.
*Maymont Homes provides residents with convenient solutions, including simplified utility billing and flexible rent payment options. Contact us for more details.
This information is deemed reliable, but not guaranteed. All measurements are approximate. Actual product and home specifications may vary in dimension or detail. Images are for representational purposes only. Some programs and services may not be available in all market areas.
Prices and availability are subject to change without notice. Advertised rent prices do not include the required application fee, the partially refundable reservation fee (due upon application approval), or the mandatory monthly utility management fee (in select market areas.) Residents must maintain renters insurance as specified in their lease. If third-party renters insurance is not provided, residents will be automatically enrolled in our Master Insurance Policy for a fee. Select homes may be located in communities that require a monthly fee for community-specific amenities or services.
For complete details, please contact a company leasing representative. Equal Housing Opportunity.
Estimated availability date is subject to change based on construction timelines and move-out confirmation.
Contact us to schedule a showing.

Map
- 1461 Cherry Hill Rd SW
- 1806 Mccollum Rd SW
- 1624 Sugarmaple Ln SW
- 2305 Lochinver Ln SW
- 1593 Cherry Hill Ln SW
- 1598 Cherry Hill Ln SW Unit 5
- 1655 Cherry Hill Rd SW
- 2203 Patriot Ct SW Unit 1
- 2315 Lochinver Ln SW
- 1675 Mccollum Rd SW
- 2325 Lochinver Ln SW
- 1875 Ebenezer Rd SW
- 2329 Lochinver Ln SW
- 2368 Ebenezer Rd SE
- 2370 Ebenezer Rd SE
- 325 Yukon Dr Unit 66
- 341 Yukon Dr Unit 58
- 4980 SE West Lake Dr
- 4811 SE West Lake Dr
- 2067 Ebenezer Rd SW
- 1624 Cherry Hill Ct SW
- 147 Old Mill Trail SW
- 1560 Cherry Hill Ct SW
- 201 Old Mill Trail SW
- 182 Old Mill Way SW
- 1651 Rolling Hills Trail SE
- 3148 Brighton Pass
- 2401 Weatherstone Cir SE
- 1560 Pin Oak Ln SE
- 1726 Hidden Acres Dr SW
- 1660 Almand Creek Dr SW
- 2354 Shadowood Dr SW
- 2634 Laurel Woods Ln SE
- 1825 Parker Rd SE
- 1609 Flat Rock Dr SW
- 2641 Laurel Woods Ln SE
- 1002 Starmoss Ln
- 630 Fern Terrace SE
- 2146 Millers Chapel Rd
- 2146 Miller Chapel Rd SE Unit Sequoia