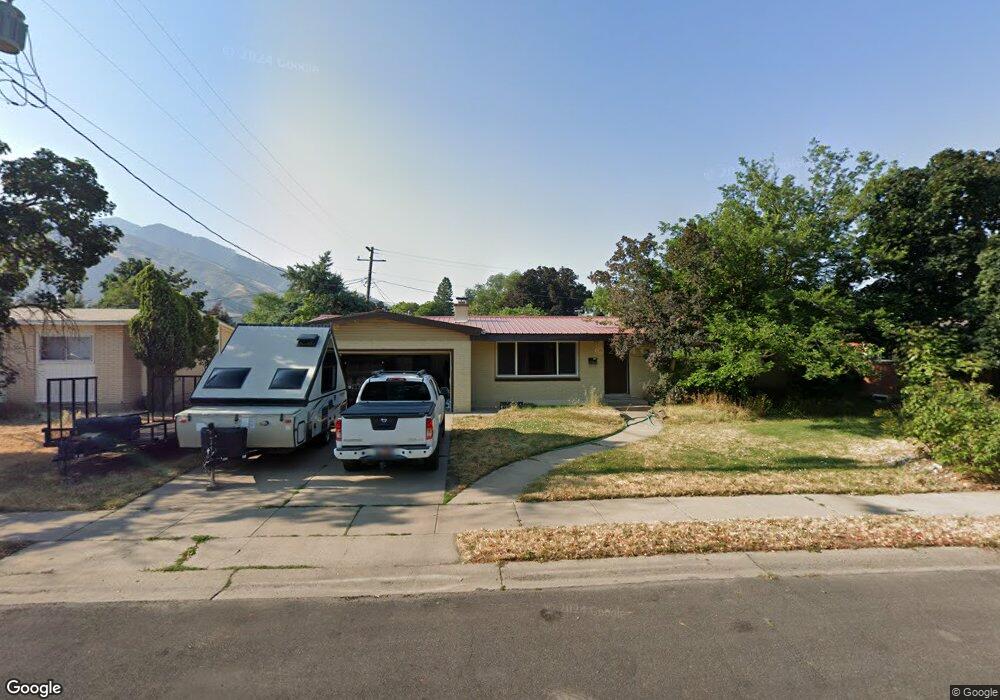
1558 E 1140 N Logan, UT 84341
Hillcrest NeighborhoodEstimated Value: $389,000 - $463,000
4
Beds
2
Baths
2,268
Sq Ft
$194/Sq Ft
Est. Value
About This Home
This home is located at 1558 E 1140 N, Logan, UT 84341 and is currently estimated at $440,459, approximately $194 per square foot. 1558 E 1140 N is a home located in Cache County with nearby schools including Hillcrest Elementary School, Mount Logan Middle School, and Logan High School.
Ownership History
Date
Name
Owned For
Owner Type
Purchase Details
Closed on
Apr 9, 2020
Sold by
Jones Randall W
Bought by
Jones Randall W and Randall W Jones Revocable Trus
Current Estimated Value
Home Financials for this Owner
Home Financials are based on the most recent Mortgage that was taken out on this home.
Original Mortgage
$52,500
Outstanding Balance
$36,269
Interest Rate
3.4%
Mortgage Type
New Conventional
Estimated Equity
$404,190
Purchase Details
Closed on
Jan 9, 2020
Sold by
Jones Randall W and Jones Randal W
Bought by
Jones Randall W and Randall W Jones Revocable Trus
Purchase Details
Closed on
Dec 2, 2014
Sold by
Jones Randall W and Jones Randal W
Bought by
Jones Randall W
Purchase Details
Closed on
Jun 18, 2014
Sold by
Tolman Bradley Justin and Kinghorn Jake
Bought by
Jones Randall W
Home Financials for this Owner
Home Financials are based on the most recent Mortgage that was taken out on this home.
Original Mortgage
$115,000
Outstanding Balance
$86,850
Interest Rate
4.09%
Mortgage Type
Credit Line Revolving
Estimated Equity
$353,609
Purchase Details
Closed on
Dec 9, 2009
Sold by
The Secretary Of Housing & Urban Develop
Bought by
Tolman Bradley Justin and Kinghorn Jake
Home Financials for this Owner
Home Financials are based on the most recent Mortgage that was taken out on this home.
Original Mortgage
$144,337
Interest Rate
5.01%
Mortgage Type
FHA
Purchase Details
Closed on
Jul 8, 2009
Sold by
Gammon John and Gammon Crystal
Bought by
Chase Home Finance Llc
Purchase Details
Closed on
Jun 2, 2009
Sold by
Chase Home Finance Llc
Bought by
Secretary Of Housing & Urban Development
Purchase Details
Closed on
Nov 9, 2006
Sold by
Gammon John N and Gammon Crystal A
Bought by
Gammon John and Gammon Crystal
Home Financials for this Owner
Home Financials are based on the most recent Mortgage that was taken out on this home.
Original Mortgage
$35,000
Interest Rate
6.36%
Mortgage Type
Stand Alone Second
Create a Home Valuation Report for This Property
The Home Valuation Report is an in-depth analysis detailing your home's value as well as a comparison with similar homes in the area
Home Values in the Area
Average Home Value in this Area
Purchase History
| Date | Buyer | Sale Price | Title Company |
|---|---|---|---|
| Jones Randall W | -- | American Secure Title Logan | |
| Jones Randall W | -- | American Secure Title Logan | |
| Jones Randall W | -- | None Available | |
| Jones Randall W | -- | Heritage Title | |
| Jones Randall W | -- | Heritage Title | |
| Jones Randal W | -- | Heritage Title | |
| Tolman Bradley Justin | -- | American Secure Title | |
| Chase Home Finance Llc | $202,006 | Backman Title Services | |
| Secretary Of Housing & Urban Development | -- | Backman Title Services | |
| Gammon John | -- | Northern Title Company |
Source: Public Records
Mortgage History
| Date | Status | Borrower | Loan Amount |
|---|---|---|---|
| Open | Jones Randall W | $52,500 | |
| Open | Jones Randal W | $115,000 | |
| Closed | Jones Randall W | $115,000 | |
| Previous Owner | Tolman Bradley Justin | $144,337 | |
| Previous Owner | Gammon John | $35,000 | |
| Previous Owner | Gammon John | $142,000 |
Source: Public Records
Tax History
| Year | Tax Paid | Tax Assessment Tax Assessment Total Assessment is a certain percentage of the fair market value that is determined by local assessors to be the total taxable value of land and additions on the property. | Land | Improvement |
|---|---|---|---|---|
| 2025 | $1,873 | $242,210 | $0 | $0 |
| 2024 | $1,934 | $242,210 | $0 | $0 |
| 2023 | $2,018 | $241,000 | $0 | $0 |
| 2022 | $1,940 | $216,250 | $0 | $0 |
| 2021 | $179 | $308,100 | $65,000 | $243,100 |
| 2020 | $1,626 | $252,000 | $65,000 | $187,000 |
| 2019 | $1,699 | $252,000 | $65,000 | $187,000 |
| 2018 | $1,413 | $191,336 | $65,000 | $126,336 |
| 2017 | $1,220 | $87,340 | $0 | $0 |
| 2016 | $1,265 | $87,340 | $0 | $0 |
| 2015 | $1,266 | $87,340 | $0 | $0 |
| 2014 | $1,145 | $87,340 | $0 | $0 |
| 2013 | -- | $83,865 | $0 | $0 |
Source: Public Records
Map
Nearby Homes
- 1133 N 1520 E
- 1512 E 1260 N
- 1357 E 1220 N
- 1535 E 1385 N
- 1450 N 1525 E
- 825 N 1400 E
- 1454 N 1400 E
- 866 Hillcrest Ave
- 1354 N 1250 E Unit 46
- 1341 N 1250 E Unit 41
- 1336 E Talmage Ln Unit 38
- 1374 N 1250 E Unit 48
- 1374 Maple Dr
- 1405 N Aspen Dr
- 1451 N Aspen Dr
- 1902 E 1500 N
- 1891 E 1500 N
- 1586 N Sharptail Cir
- 1901 Southpointe Ct
- 1535 Sumac Dr
Your Personal Tour Guide
Ask me questions while you tour the home.