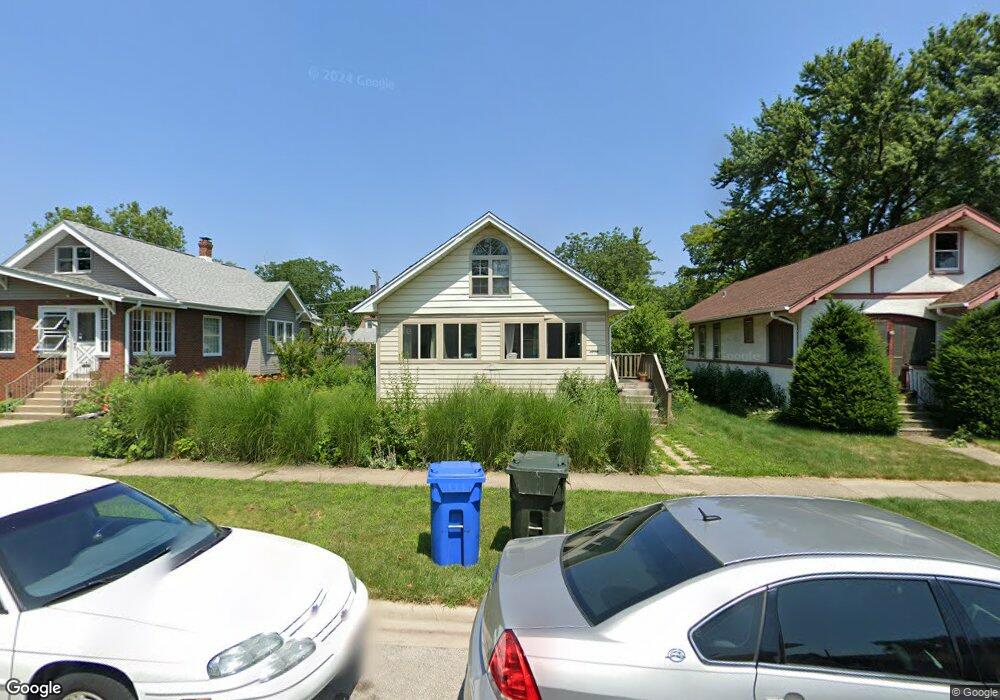
1558 Henry Ave Unit 2 Des Plaines, IL 60016
Estimated Value: $195,000 - $334,777
1
Bed
1
Bath
750
Sq Ft
$357/Sq Ft
Est. Value
About This Home
This home is located at 1558 Henry Ave Unit 2, Des Plaines, IL 60016 and is currently estimated at $267,926, approximately $357 per square foot. 1558 Henry Ave Unit 2 is a home located in Cook County with nearby schools including Central Elementary School, Chippewa Middle School, and Maine West High School.
Ownership History
Date
Name
Owned For
Owner Type
Purchase Details
Closed on
Jul 24, 2013
Sold by
Prashantna Ram
Bought by
Todorov Radoslav
Current Estimated Value
Purchase Details
Closed on
Feb 21, 2012
Sold by
Myerson Nina N
Bought by
Prashantna Ram
Purchase Details
Closed on
Jun 13, 2007
Sold by
Meagher James E and Meagher Barbara T
Bought by
Myerson Nina N
Home Financials for this Owner
Home Financials are based on the most recent Mortgage that was taken out on this home.
Original Mortgage
$208,000
Interest Rate
6.37%
Mortgage Type
Unknown
Purchase Details
Closed on
May 11, 2001
Sold by
Blair John and Blair Dorothy M
Bought by
Meagher James E and Meagher Barbara T
Home Financials for this Owner
Home Financials are based on the most recent Mortgage that was taken out on this home.
Original Mortgage
$152,000
Interest Rate
7.02%
Create a Home Valuation Report for This Property
The Home Valuation Report is an in-depth analysis detailing your home's value as well as a comparison with similar homes in the area
Home Values in the Area
Average Home Value in this Area
Purchase History
| Date | Buyer | Sale Price | Title Company |
|---|---|---|---|
| Todorov Radoslav | $83,000 | Chicago Title Insurance Comp | |
| Prashantna Ram | $85,000 | Alliance Title Corporation | |
| Myerson Nina N | $260,000 | Cst | |
| Meagher James E | $190,000 | Chicago Title Insurance Co |
Source: Public Records
Mortgage History
| Date | Status | Borrower | Loan Amount |
|---|---|---|---|
| Previous Owner | Myerson Nina N | $208,000 | |
| Previous Owner | Meagher James E | $152,000 |
Source: Public Records
Tax History Compared to Growth
Tax History
| Year | Tax Paid | Tax Assessment Tax Assessment Total Assessment is a certain percentage of the fair market value that is determined by local assessors to be the total taxable value of land and additions on the property. | Land | Improvement |
|---|---|---|---|---|
| 2024 | $6,244 | $27,000 | $4,960 | $22,040 |
| 2023 | $6,067 | $27,000 | $4,960 | $22,040 |
| 2022 | $6,067 | $27,000 | $4,960 | $22,040 |
| 2021 | $4,653 | $18,469 | $4,030 | $14,439 |
| 2020 | $4,644 | $18,469 | $4,030 | $14,439 |
| 2019 | $4,600 | $20,521 | $4,030 | $16,491 |
| 2018 | $4,452 | $18,323 | $3,565 | $14,758 |
| 2017 | $4,391 | $18,323 | $3,565 | $14,758 |
| 2016 | $4,914 | $20,182 | $3,565 | $16,617 |
| 2015 | $4,525 | $17,591 | $3,100 | $14,491 |
| 2014 | $4,446 | $17,591 | $3,100 | $14,491 |
| 2013 | $5,484 | $19,004 | $3,100 | $15,904 |
Source: Public Records
Map
Nearby Homes
- 1524 Oakwood Ave
- 1489 E Algonquin Rd
- 960 S River Rd Unit 410
- 960 S River Rd Unit 208
- 905 Center St Unit B507
- 905 Center St Unit B208
- 1365 Ashland Ave Unit 302
- 843 Lexington Cir E
- 1278 E River Dr
- 1700 E Forest Ave
- 821 Lexington Cir E
- 750 Pearson St Unit 904
- 711 S River Rd Unit 401
- 799 Graceland Ave Unit 504A
- 915 Graceland Ave Unit 1E
- 1685 Mill St Unit 605
- 2015 Busse Hwy
- 1536 Orchard St
- 1632 S Elm St
- 1374 Jefferson St
- 1558 Henry Ave
- 1550 Henry Ave
- 1566 Henry Ave
- 1574 Henry Ave
- 1540 Henry Ave
- 1528 Henry Ave
- 1561 E Walnut Ave
- 1553 E Walnut Ave
- 1584 Henry Ave
- 1569 E Walnut Ave
- 1543 E Walnut Ave
- 1561 Henry Ave
- 1551 Henry Ave
- 1531 E Walnut Ave
- 1579 E Walnut Ave
- 1524 Henry Ave
- 1569 Henry Ave
- 1543 Henry Ave
- 1596 Henry Ave
- 1577 Henry Ave