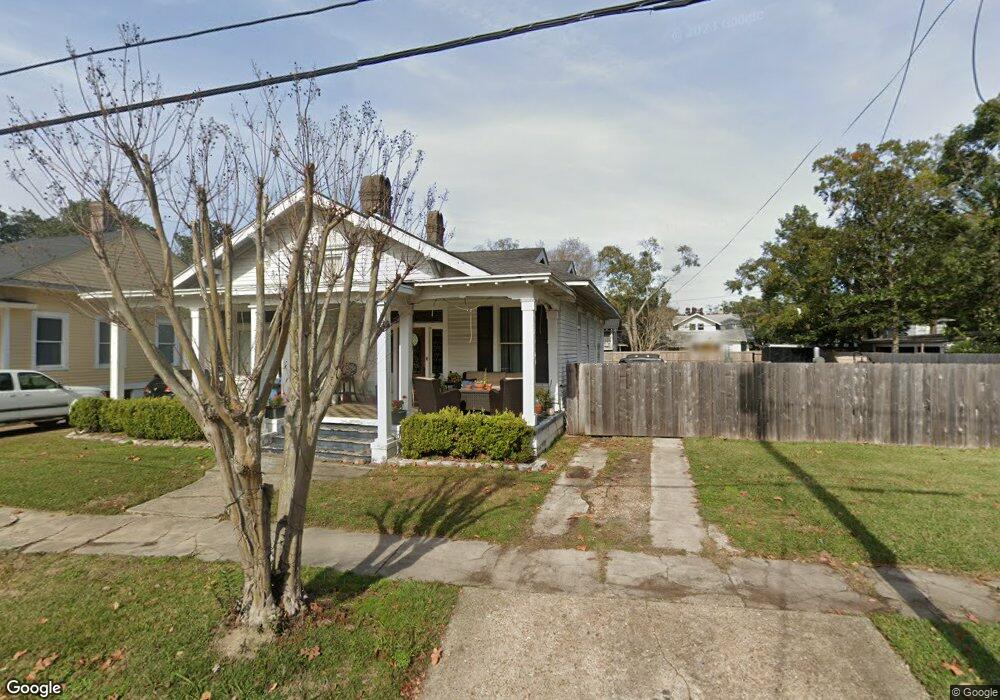
1558 Luling St Mobile, AL 36604
Midtown Mobile NeighborhoodEstimated Value: $303,000 - $392,000
3
Beds
2
Baths
2,186
Sq Ft
$158/Sq Ft
Est. Value
About This Home
This home is located at 1558 Luling St, Mobile, AL 36604 and is currently estimated at $344,896, approximately $157 per square foot. 1558 Luling St is a home located in Mobile County with nearby schools including Leinkauf Elementary School, Calloway Smith Middle School, and Murphy High School.
Ownership History
Date
Name
Owned For
Owner Type
Purchase Details
Closed on
Sep 26, 2013
Sold by
Smith Jason C and Smith Kim G
Bought by
Patten Patrick Park
Current Estimated Value
Home Financials for this Owner
Home Financials are based on the most recent Mortgage that was taken out on this home.
Original Mortgage
$195,000
Outstanding Balance
$144,570
Interest Rate
4.39%
Mortgage Type
Future Advance Clause Open End Mortgage
Estimated Equity
$200,326
Purchase Details
Closed on
Jun 25, 2002
Sold by
Solomon Gabriel Whitfield and Solomon Heather Ann
Bought by
Smith Kim Graham and Smith Jason Craig
Home Financials for this Owner
Home Financials are based on the most recent Mortgage that was taken out on this home.
Original Mortgage
$141,775
Interest Rate
6.79%
Purchase Details
Closed on
Jul 23, 1999
Sold by
Kennedy Helen M and Kennedy Sheila Ann
Bought by
Solomon Gabriel Whitfield
Home Financials for this Owner
Home Financials are based on the most recent Mortgage that was taken out on this home.
Original Mortgage
$137,700
Interest Rate
7.51%
Mortgage Type
VA
Create a Home Valuation Report for This Property
The Home Valuation Report is an in-depth analysis detailing your home's value as well as a comparison with similar homes in the area
Home Values in the Area
Average Home Value in this Area
Purchase History
| Date | Buyer | Sale Price | Title Company |
|---|---|---|---|
| Patten Patrick Park | $195,000 | None Available | |
| Smith Kim Graham | $144,000 | -- | |
| Solomon Gabriel Whitfield | $135,000 | -- |
Source: Public Records
Mortgage History
| Date | Status | Borrower | Loan Amount |
|---|---|---|---|
| Open | Patten Patrick Park | $195,000 | |
| Previous Owner | Smith Kim Graham | $141,775 | |
| Previous Owner | Solomon Gabriel Whitfield | $137,700 |
Source: Public Records
Tax History
| Year | Tax Paid | Tax Assessment Tax Assessment Total Assessment is a certain percentage of the fair market value that is determined by local assessors to be the total taxable value of land and additions on the property. | Land | Improvement |
|---|---|---|---|---|
| 2025 | $1,299 | $21,340 | $5,250 | $16,090 |
| 2024 | $1,299 | $20,440 | $5,400 | $15,040 |
| 2023 | $1,329 | $21,960 | $5,250 | $16,710 |
| 2022 | $1,294 | $21,410 | $5,250 | $16,160 |
| 2021 | $1,337 | $21,040 | $5,100 | $15,940 |
| 2020 | $1,337 | $42,080 | $10,200 | $31,880 |
| 2019 | $1,402 | $44,160 | $11,440 | $32,720 |
| 2018 | $1,402 | $22,080 | $0 | $0 |
| 2017 | $1,402 | $22,080 | $0 | $0 |
| 2016 | $1,469 | $24,040 | $0 | $0 |
| 2013 | $1,278 | $20,680 | $0 | $0 |
Source: Public Records
Map
Nearby Homes
- 1561 Bruister St
- 121 Macy Place
- 36 S Lafayette St
- 1505 Government St
- 1410 Government St
- 14 S Lafayette St
- 1602 Government St Unit 1A
- 1602 Government St Unit 1B
- 1563 Government St
- 257 McDonald Ave
- 1367 Brown St
- 17 McPhillips Ave
- 29 Houston St
- 101 Bradford Ave
- 54 Houston St
- 66 Houston St
- 110 Houston St
- 267 Park Terrace
- 271 Park Terrace
- 300 Dexter Ave
- 108 S Catherine St
- 1560 Luling St
- 110 S Catherine St
- 106 S Catherine St
- 1562 Luling St
- 150 S Catherine St
- 1555 Monterey Place
- 1559 Monterey Place
- 1557 Monterey Place
- 1564 Luling St
- 104 S Catherine St
- 1557 Luling St
- 1559 Luling St
- 1561 Monterey Place
- 152 S Catherine St
- 1553 Monterey Place
- 1561 Luling St
- 1551 Monterey Place Unit A
- 1551 Monterey Place Unit B
- 1566 Luling St
Your Personal Tour Guide
Ask me questions while you tour the home.