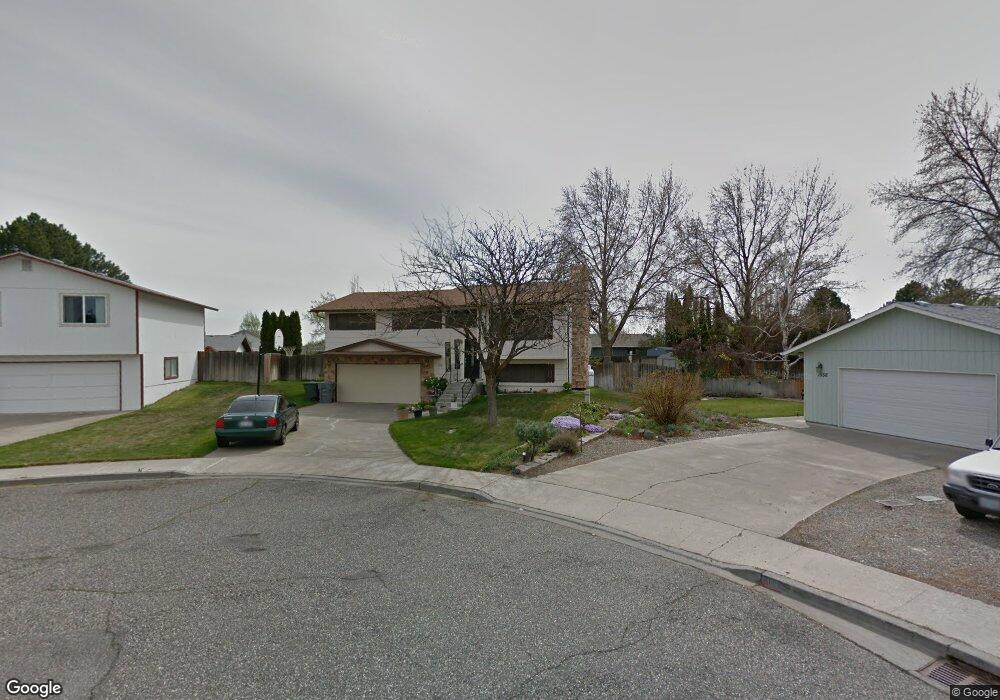
1558 Ridgeview Ct Unit Park Like Yard Richland, WA 99352
Estimated Value: $401,834 - $459,000
3
Beds
2
Baths
1,662
Sq Ft
$254/Sq Ft
Est. Value
About This Home
This home is located at 1558 Ridgeview Ct Unit Park Like Yard, Richland, WA 99352 and is currently estimated at $421,459, approximately $253 per square foot. 1558 Ridgeview Ct Unit Park Like Yard is a home located in Benton County with nearby schools including Badger Mountain Elementary School, Carmichael Middle School, and Richland High School.
Ownership History
Date
Name
Owned For
Owner Type
Purchase Details
Closed on
Mar 21, 2016
Sold by
Houser Bethany A and Richardson Casey E
Bought by
Porter Steven J
Current Estimated Value
Home Financials for this Owner
Home Financials are based on the most recent Mortgage that was taken out on this home.
Original Mortgage
$188,030
Outstanding Balance
$147,425
Interest Rate
3.37%
Mortgage Type
FHA
Estimated Equity
$274,034
Purchase Details
Closed on
Dec 26, 2014
Sold by
Stack Cory and Stack Patsy
Bought by
Houser Bethany A and Richardson Casey E
Home Financials for this Owner
Home Financials are based on the most recent Mortgage that was taken out on this home.
Original Mortgage
$173,695
Interest Rate
3.75%
Mortgage Type
FHA
Purchase Details
Closed on
May 16, 2007
Sold by
Wingle Larry and Wingle Debbie
Bought by
Stack Cory and Stack Patsy
Create a Home Valuation Report for This Property
The Home Valuation Report is an in-depth analysis detailing your home's value as well as a comparison with similar homes in the area
Home Values in the Area
Average Home Value in this Area
Purchase History
| Date | Buyer | Sale Price | Title Company |
|---|---|---|---|
| Porter Steven J | $191,500 | Columbia Title Company | |
| Houser Bethany A | $176,619 | Chicago Title Insurance Co | |
| Stack Cory | $165,000 | Frontier Title & Esc |
Source: Public Records
Mortgage History
| Date | Status | Borrower | Loan Amount |
|---|---|---|---|
| Open | Porter Steven J | $188,030 | |
| Previous Owner | Houser Bethany A | $173,695 |
Source: Public Records
Tax History Compared to Growth
Tax History
| Year | Tax Paid | Tax Assessment Tax Assessment Total Assessment is a certain percentage of the fair market value that is determined by local assessors to be the total taxable value of land and additions on the property. | Land | Improvement |
|---|---|---|---|---|
| 2024 | $2,986 | $338,500 | $50,000 | $288,500 |
| 2023 | $2,986 | $317,890 | $50,000 | $267,890 |
| 2022 | $2,695 | $269,810 | $50,000 | $219,810 |
| 2021 | $2,571 | $242,330 | $50,000 | $192,330 |
| 2020 | $2,601 | $221,730 | $50,000 | $171,730 |
| 2019 | $2,078 | $212,230 | $36,000 | $176,230 |
| 2018 | $2,151 | $181,850 | $36,000 | $145,850 |
| 2017 | $1,890 | $157,540 | $36,000 | $121,540 |
| 2016 | $1,864 | $157,540 | $36,000 | $121,540 |
| 2015 | $1,763 | $157,540 | $36,000 | $121,540 |
| 2014 | -- | $146,130 | $36,000 | $110,130 |
| 2013 | -- | $146,130 | $36,000 | $110,130 |
Source: Public Records
Map
Nearby Homes
- 1606 Amon Dr
- 1547 Tieton Ct
- 1606 Elementary St
- 3 Keene Rd Unit Lot 3
- 2 Keene Rd Unit Lot 2
- 1 Keene Rd Unit Lot 1
- 100 Hills Way W
- 290 Gage Blvd
- 288 Gage Blvd
- 201 Ashwood St
- 303 Gage Blvd Unit 209
- 303 Gage Blvd
- 303 Gage Blvd Unit 304
- 303 Gage Blvd Unit 119
- 303 Gage Blvd Unit 207
- 303 Gage Blvd Unit 122
- 204 Brookwood Loop
- 289 Gage Blvd
- 1924 Mint Loop
- 1433 Rimrock Ave
- 1558 Ridgeview Ct Unit SOUTH RICHLAND UNDER
- 1558 Ridgeview Ct
- 1556 Ridgeview Ct
- 1581 Cimarron Ave
- 1560 Ridgeview Ct Unit Tile updates with ne
- 1560 Ridgeview Ct Unit South Richland 4 bd.
- 1560 Ridgeview Ct
- 1587 Cimarron Ave
- 1575 Cimarron Ave
- 68 Chaparral St
- 62 Chaparral St
- 1553 Ridgeview Ct
- 1565 Ridgeview Ct
- 1593 Cimarron Ave
- 1571 Ridgeview Ct
- 56 Chaparral St
- 1551 Ridgeview Ct
- 1549 Ridgeview Ct
- 1578 Cimarron Ave
- 50 Chaparral St