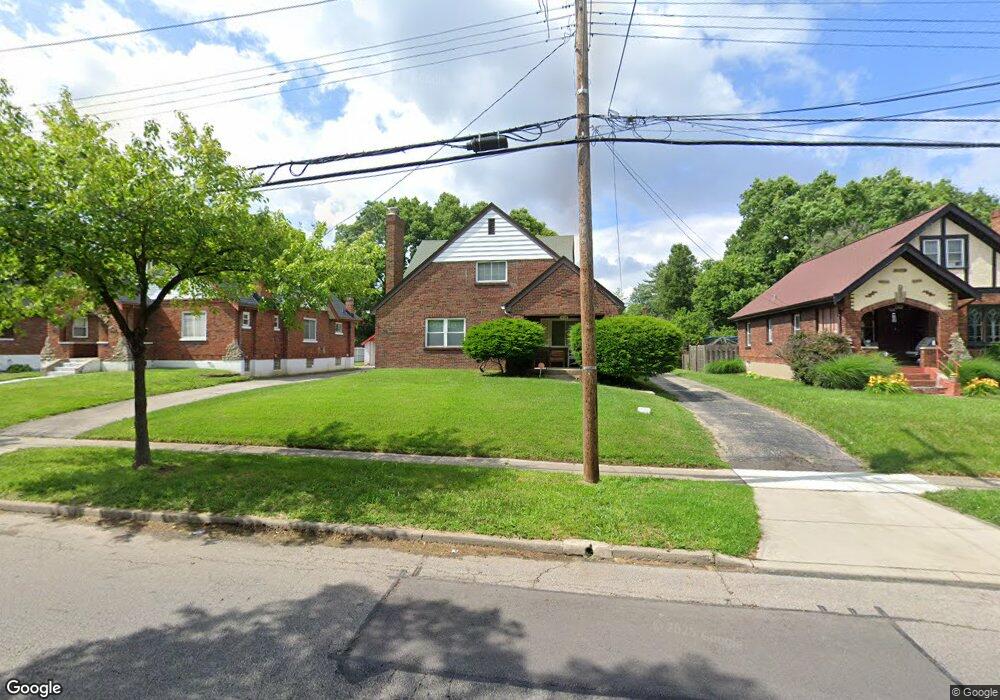
1558 Section Rd Cincinnati, OH 45237
Roselawn NeighborhoodEstimated Value: $240,000 - $310,000
3
Beds
3
Baths
2,051
Sq Ft
$128/Sq Ft
Est. Value
About This Home
This home is located at 1558 Section Rd, Cincinnati, OH 45237 and is currently estimated at $261,567, approximately $127 per square foot. 1558 Section Rd is a home located in Hamilton County with nearby schools including Roselawn Condon School, Shroder High School, and Clark Montessori High School.
Create a Home Valuation Report for This Property
The Home Valuation Report is an in-depth analysis detailing your home's value as well as a comparison with similar homes in the area
Home Values in the Area
Average Home Value in this Area
Tax History
| Year | Tax Paid | Tax Assessment Tax Assessment Total Assessment is a certain percentage of the fair market value that is determined by local assessors to be the total taxable value of land and additions on the property. | Land | Improvement |
|---|---|---|---|---|
| 2025 | $3,452 | $65,990 | $10,812 | $55,178 |
| 2024 | $3,357 | $65,990 | $10,812 | $55,178 |
| 2023 | $3,480 | $65,990 | $10,812 | $55,178 |
| 2022 | $2,181 | $40,597 | $9,436 | $31,161 |
| 2021 | $2,085 | $40,597 | $9,436 | $31,161 |
| 2020 | $2,158 | $40,597 | $9,436 | $31,161 |
| 2019 | $2,109 | $37,244 | $8,656 | $28,588 |
| 2018 | $2,112 | $37,244 | $8,656 | $28,588 |
| 2017 | $2,000 | $37,244 | $8,656 | $28,588 |
| 2016 | $1,886 | $35,336 | $8,827 | $26,509 |
| 2015 | $1,707 | $35,336 | $8,827 | $26,509 |
| 2014 | $1,720 | $35,336 | $8,827 | $26,509 |
| 2013 | $1,704 | $34,644 | $8,656 | $25,988 |
Source: Public Records
Map
Nearby Homes
- 1519 Section Rd
- 1622 Shenandoah Ave
- 1501 Summit Rd
- 1522 Kenova Ave
- 1535 Kenova Ave
- 7833 Dawn Rd
- 1808 Crest Hill Ave
- 7119 Eastlawn Dr
- 8081 Woodbine Ave
- 6771 Elbrook Ave
- 6770 Elbrook Ave
- 6750 Elbrook Ave
- 3 W 73rd St
- 2344 Losantiville Ave
- 130 Nansen St
- 29 Hartwell Ct
- 6402 Mayflower Ave
- 7123 Fairpark Ave
- 120 W Seventy Second St
- 2063 E Seymour Ave
- 1562 Section Rd
- 1554 Section Rd
- 1566 Section Rd
- 1550 Section Rd
- 1527 Northwood Dr
- 1570 Section Rd
- 1523 Northwood Dr
- 1546 Section Rd
- 1531 Northwood Dr
- 1519 Northwood Dr
- 1535 Northwood Dr
- 1515 Northwood Dr
- 1563 Section Rd
- 1602 Section Rd
- 1559 Section Rd
- 1542 Section Rd
- 1539 Northwood Dr
- 1511 Northwood Dr
- 1567 Section Rd
- 1555 Section Rd
Your Personal Tour Guide
Ask me questions while you tour the home.