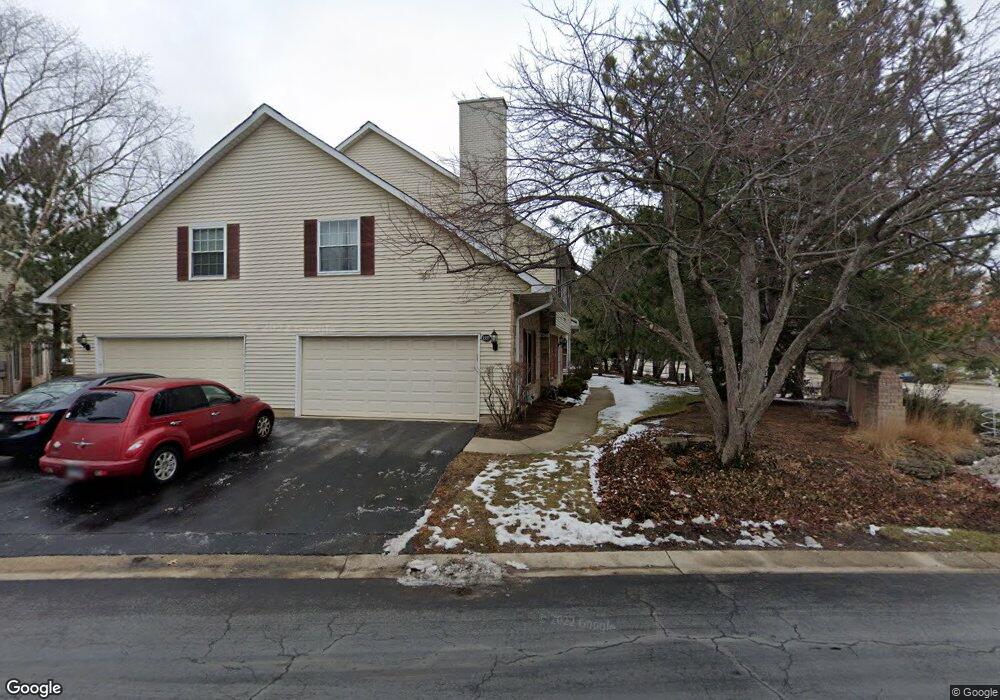
1559 Laurel Oaks Dr Unit 1 Streamwood, IL 60107
Estimated Value: $374,000 - $421,000
3
Beds
3
Baths
2,345
Sq Ft
$169/Sq Ft
Est. Value
About This Home
This home is located at 1559 Laurel Oaks Dr Unit 1, Streamwood, IL 60107 and is currently estimated at $395,687, approximately $168 per square foot. 1559 Laurel Oaks Dr Unit 1 is a home located in Cook County with nearby schools including Hilltop Elementary School, Canton Middle School, and Streamwood High School.
Ownership History
Date
Name
Owned For
Owner Type
Purchase Details
Closed on
Jun 27, 2011
Sold by
Bank Of America National Association
Bought by
Schmitt Denver P and Schmitt Natalie
Current Estimated Value
Home Financials for this Owner
Home Financials are based on the most recent Mortgage that was taken out on this home.
Original Mortgage
$144,735
Interest Rate
4.37%
Mortgage Type
FHA
Purchase Details
Closed on
May 28, 2004
Sold by
John Othlund Christine and John Orthlund
Bought by
Chukwuemeka Richard George
Home Financials for this Owner
Home Financials are based on the most recent Mortgage that was taken out on this home.
Original Mortgage
$241,000
Interest Rate
6.5%
Mortgage Type
Unknown
Purchase Details
Closed on
Oct 30, 2002
Sold by
Harrell
Bought by
John Othlund Christine and John Orthlund
Create a Home Valuation Report for This Property
The Home Valuation Report is an in-depth analysis detailing your home's value as well as a comparison with similar homes in the area
Home Values in the Area
Average Home Value in this Area
Purchase History
| Date | Buyer | Sale Price | Title Company |
|---|---|---|---|
| Schmitt Denver P | $148,500 | Cti | |
| Chukwuemeka Richard George | $241,000 | Pntn | |
| John Othlund Christine | $205,000 | -- |
Source: Public Records
Mortgage History
| Date | Status | Borrower | Loan Amount |
|---|---|---|---|
| Previous Owner | Schmitt Denver P | $144,735 | |
| Previous Owner | Chukwuemeka Richard George | $241,000 |
Source: Public Records
Tax History Compared to Growth
Tax History
| Year | Tax Paid | Tax Assessment Tax Assessment Total Assessment is a certain percentage of the fair market value that is determined by local assessors to be the total taxable value of land and additions on the property. | Land | Improvement |
|---|---|---|---|---|
| 2024 | $7,365 | $24,000 | $4,500 | $19,500 |
| 2023 | $7,182 | $24,000 | $4,500 | $19,500 |
| 2022 | $7,182 | $24,000 | $4,500 | $19,500 |
| 2021 | $7,742 | $21,228 | $3,078 | $18,150 |
| 2020 | $7,614 | $21,228 | $3,078 | $18,150 |
| 2019 | $7,509 | $23,587 | $3,078 | $20,509 |
| 2018 | $7,366 | $21,039 | $2,693 | $18,346 |
| 2017 | $6,105 | $21,039 | $2,693 | $18,346 |
| 2016 | $5,982 | $21,039 | $2,693 | $18,346 |
| 2015 | $6,141 | $19,990 | $2,436 | $17,554 |
| 2014 | $6,074 | $19,990 | $2,436 | $17,554 |
| 2013 | $5,853 | $19,990 | $2,436 | $17,554 |
Source: Public Records
Map
Nearby Homes
- 1504 Laurel Oaks Dr
- 167 Southwicke Dr Unit 3404D
- 71 Monarch Dr Unit 40126L
- 180 Monarch Dr Unit 250126S
- 309 Monarch Dr Unit 26S
- 1420 Yellowstone Dr
- 1463 Yellowstone Dr
- 56 Veneto Ct
- 35 Veneto Ct
- 772 Red Oak Dr
- 105 Black Hill Dr
- 1108 Oak Ridge Dr
- 36 Evergreen Dr
- 529 Horizon Dr Unit 18529A
- 3 Taylor Ct Unit B
- 464 Horizon Dr Unit 3464A
- 1 Winterberry Ct
- 9N Merry Oaks Rd
- 69 Colonial Ct
- 1324 Smoketree Ln
- 1557 Laurel Oaks Dr
- 1537 Laurel Oaks Dr Unit 1
- 1537 Laurel Oaks Dr Unit 1537
- 1539 Laurel Oaks Dr
- 1519 Laurel Oaks Dr Unit 1
- 1517 Laurel Oaks Dr
- 1515 Laurel Oaks Dr Unit B
- 1513 Laurel Oaks Dr Unit 1
- 1554 Laurel Oaks Dr Unit 1
- 1556 Laurel Oaks Dr
- 1556 Laurel Oaks Dr Unit 1556
- 1540 Laurel Oaks Dr Unit 1
- 1511 Laurel Oaks Dr
- 1532 Laurel Oaks Dr
- 1550 Laurel Oaks Dr
- 1509 Laurel Oaks Dr Unit 1
- 1542 Laurel Oaks Dr
- 1548 Laurel Oaks Dr Unit 1
- 1507 Laurel Oaks Dr Unit 1
- 1520 Laurel Oaks Dr