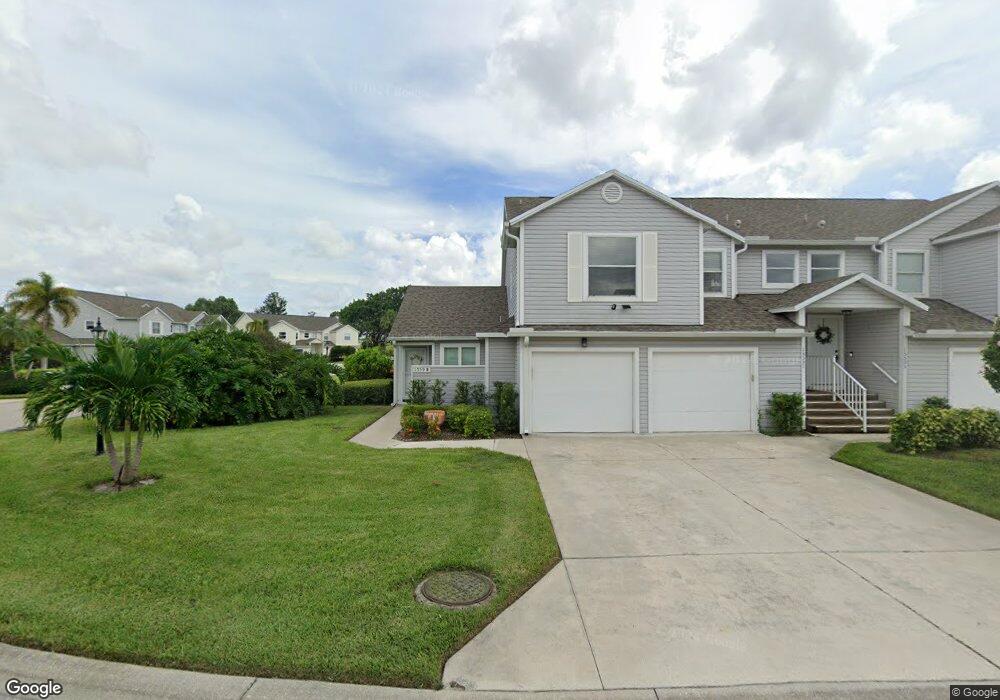
1559 Trafalgar Ln Unit 101Q Naples, FL 34116
Estimated Value: $247,000 - $287,000
2
Beds
2
Baths
1,030
Sq Ft
$260/Sq Ft
Est. Value
About This Home
This home is located at 1559 Trafalgar Ln Unit 101Q, Naples, FL 34116 and is currently estimated at $267,928, approximately $260 per square foot. 1559 Trafalgar Ln Unit 101Q is a home located in Collier County with nearby schools including Calusa Park Elementary School, East Naples Middle School, and Lely High School.
Ownership History
Date
Name
Owned For
Owner Type
Purchase Details
Closed on
Jan 27, 2015
Sold by
Oest Lucas
Bought by
Beauvais Sharon N and Deblois Tina
Current Estimated Value
Purchase Details
Closed on
May 9, 2014
Sold by
Citimortgage Inc
Bought by
Oest Lucas
Purchase Details
Closed on
Oct 8, 2013
Sold by
Smith David Stuart and Smith Barbara Ann
Bought by
Citimortgage Inc
Purchase Details
Closed on
Nov 19, 2004
Sold by
Smith Barbara and Smith David
Bought by
Smith David
Purchase Details
Closed on
Dec 29, 2003
Sold by
Pringle David M and Pringle Dorothy A
Bought by
Smith David S
Home Financials for this Owner
Home Financials are based on the most recent Mortgage that was taken out on this home.
Original Mortgage
$87,000
Interest Rate
5.82%
Mortgage Type
Purchase Money Mortgage
Purchase Details
Closed on
Jul 19, 2000
Sold by
Pringle David M and Pringle Dorothy A
Bought by
Pringle David M
Create a Home Valuation Report for This Property
The Home Valuation Report is an in-depth analysis detailing your home's value as well as a comparison with similar homes in the area
Home Values in the Area
Average Home Value in this Area
Purchase History
| Date | Buyer | Sale Price | Title Company |
|---|---|---|---|
| Beauvais Sharon N | $128,100 | Title Services Of Collier Co | |
| Oest Lucas | $83,500 | Servicelink | |
| Citimortgage Inc | -- | None Available | |
| Smith David | -- | -- | |
| Smith David S | $135,000 | -- | |
| Pringle David M | -- | -- |
Source: Public Records
Mortgage History
| Date | Status | Borrower | Loan Amount |
|---|---|---|---|
| Previous Owner | Smith David S | $87,000 |
Source: Public Records
Tax History Compared to Growth
Tax History
| Year | Tax Paid | Tax Assessment Tax Assessment Total Assessment is a certain percentage of the fair market value that is determined by local assessors to be the total taxable value of land and additions on the property. | Land | Improvement |
|---|---|---|---|---|
| 2025 | $2,111 | $183,541 | -- | -- |
| 2024 | $2,080 | $166,855 | -- | -- |
| 2023 | $2,080 | $151,686 | $0 | $0 |
| 2022 | $1,858 | $137,896 | $0 | $0 |
| 2021 | $1,658 | $125,360 | $0 | $125,360 |
| 2020 | $1,558 | $118,150 | $0 | $118,150 |
| 2019 | $1,584 | $118,965 | $0 | $0 |
| 2018 | $1,443 | $108,150 | $0 | $108,150 |
| 2017 | $1,459 | $109,180 | $0 | $109,180 |
| 2016 | $1,446 | $109,180 | $0 | $0 |
| 2015 | $1,262 | $92,000 | $0 | $0 |
| 2014 | -- | $84,200 | $0 | $0 |
Source: Public Records
Map
Nearby Homes
- 1526 Trafalgar Ln Unit J-102
- 1462 Churchill Cir Unit 101
- 1350 Churchill Cir Unit 102
- 1343 Churchill Cir Unit 202
- 1348 Monarch Cir
- 1330 Derbyshire Ct Unit 104
- 1429 Monarch Cir
- 1200 Commonwealth Cir Unit 201
- 1207 Commonwealth Cir Unit 201
- 3064 54th Terrace SW
- 1224 Commonwealth Cir Unit 203
- 1211 Commonwealth Cir Unit 202
- 5442 29th Place SW
- 5472 Golden Gate Pkwy
- 7685 Meadow Lakes Dr Unit 1301
- 745 Landover Cir Unit 104
- 1559 Trafalgar Ln Unit Q-201
- 1559 Trafalgar Ln Unit 202Q
- 1559 Trafalgar Ln Unit 201Q
- 1559 Trafalgar Ln Unit 102Q
- 1559 Trafalgar Ln Unit D
- 1566 Trafalgar Ln Unit E-102
- 1566 Trafalgar Ln Unit D
- 1566 Trafalgar Ln Unit 202E
- 1566 Trafalgar Ln Unit 201E
- 1566 Trafalgar Ln Unit 102E
- 1566 Trafalgar Ln Unit 101E
- 1575 Trafalgar Ln Unit D
- 1575 Trafalgar Ln Unit P-201
- 1575 Trafalgar Ln Unit 202P
- 1575 Trafalgar Ln Unit 201P
- 1575 Trafalgar Ln Unit 102P
- 1575 Trafalgar Ln Unit 101P
- 1575 Trafalgar Ln Unit C
- 1535 Trafalgar Ln Unit A
- 1535 Trafalgar Ln Unit C-201