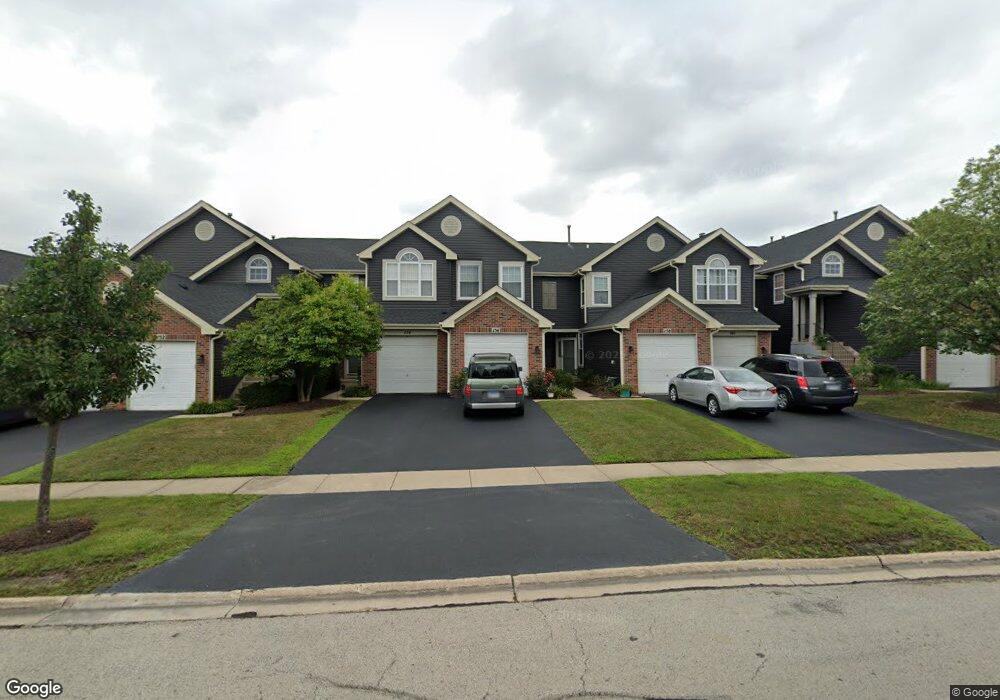
156 E Lake Ridge Dr Unit 104 Glendale Heights, IL 60139
Estimated Value: $269,000 - $280,238
2
Beds
2
Baths
1,378
Sq Ft
$198/Sq Ft
Est. Value
About This Home
This home is located at 156 E Lake Ridge Dr Unit 104, Glendale Heights, IL 60139 and is currently estimated at $272,560, approximately $197 per square foot. 156 E Lake Ridge Dr Unit 104 is a home located in DuPage County with nearby schools including Marquardt Middle School, Glenbard East High School, and St Isidore School.
Ownership History
Date
Name
Owned For
Owner Type
Purchase Details
Closed on
Sep 23, 2005
Sold by
Tamayao Angelita
Bought by
Dizon Roderick and Dizon Laureen
Current Estimated Value
Home Financials for this Owner
Home Financials are based on the most recent Mortgage that was taken out on this home.
Original Mortgage
$177,000
Outstanding Balance
$94,517
Interest Rate
5.82%
Mortgage Type
Fannie Mae Freddie Mac
Estimated Equity
$178,043
Purchase Details
Closed on
Jul 22, 2004
Sold by
Riban Michael and Riban Theresa
Bought by
Tamayao Angelita
Home Financials for this Owner
Home Financials are based on the most recent Mortgage that was taken out on this home.
Original Mortgage
$175,700
Interest Rate
7.5%
Mortgage Type
Purchase Money Mortgage
Purchase Details
Closed on
Apr 11, 1995
Sold by
Lions Gate At Brittany Woods L P
Bought by
Riban Michael and Riban Theresa
Create a Home Valuation Report for This Property
The Home Valuation Report is an in-depth analysis detailing your home's value as well as a comparison with similar homes in the area
Home Values in the Area
Average Home Value in this Area
Purchase History
| Date | Buyer | Sale Price | Title Company |
|---|---|---|---|
| Dizon Roderick | -- | Stewart Title Company | |
| Tamayao Angelita | $185,000 | Burnet Title Llc | |
| Riban Michael | $120,000 | -- |
Source: Public Records
Mortgage History
| Date | Status | Borrower | Loan Amount |
|---|---|---|---|
| Open | Dizon Roderick | $177,000 | |
| Previous Owner | Tamayao Angelita | $175,700 |
Source: Public Records
Tax History Compared to Growth
Tax History
| Year | Tax Paid | Tax Assessment Tax Assessment Total Assessment is a certain percentage of the fair market value that is determined by local assessors to be the total taxable value of land and additions on the property. | Land | Improvement |
|---|---|---|---|---|
| 2024 | $5,635 | $69,175 | $20,000 | $49,175 |
| 2023 | $5,240 | $63,260 | $18,290 | $44,970 |
| 2022 | $5,230 | $58,010 | $18,170 | $39,840 |
| 2021 | $5,126 | $55,110 | $17,260 | $37,850 |
| 2020 | $4,830 | $53,770 | $16,840 | $36,930 |
| 2019 | $4,863 | $53,910 | $16,180 | $37,730 |
| 2018 | $3,832 | $40,450 | $12,140 | $28,310 |
| 2017 | $3,641 | $37,490 | $11,250 | $26,240 |
| 2016 | $3,438 | $34,690 | $10,410 | $24,280 |
| 2015 | $3,347 | $32,370 | $9,710 | $22,660 |
| 2014 | $2,874 | $28,480 | $5,820 | $22,660 |
| 2013 | $2,904 | $29,460 | $6,020 | $23,440 |
Source: Public Records
Map
Nearby Homes
- 2257 Lake Ridge Dr Unit 74
- 169 E Lake Ridge Dr Unit 21
- 201 N Waters Edge Dr Unit 101
- 161 N Waters Edge Dr Unit 202
- 187 W Army Trail Rd
- 2018 Stonefield Dr
- 133 Harding Ct
- 2158 College Dr Unit 7
- 2155 College Dr Unit 7
- 67 Stonefield Dr
- 279 Blue Spruce Ln
- 258 Thrasher St
- 253 Sterling Ln
- 135 Fairlane Ct Unit B
- 241 Army Trail Rd
- 195 Duxbury Ct Unit D
- 120 Brewster Ct Unit D
- 1943 Towner Ln
- 1941 Aspen Ln
- 181 Lakeview Ct
- 2185 Lake Ridge Dr Unit 56
- 2167 Lake Ridge Dr Unit 5
- 147 E Lake Ridge Dr Unit I2
- 2165 Lake Ridge Dr Unit 46
- 2185 Lake Ridge Dr
- 2251 Lake Ridge Dr Unit 130
- 2232 Lake Ridge Dr Unit 85
- 2251 Lake Ridge Dr Unit 71
- 2261 Lake Ridge Dr Unit 76
- 2255 Lake Ridge Dr Unit 73
- 2237 Lake Ridge Dr Unit 63
- 2263 Lake Ridge Dr Unit 77
- 2233 Lake Ridge Dr Unit 65
- 2236 Lake Ridge Dr Unit 87
- 165 E Lake Ridge Dr Unit 23
- 2199 Gladstone Ct Unit 127
- 2234 Lake Ridge Dr Unit 86
- 2210 Lake Ridge Dr Unit 98
- 2169 Lake Ridge Dr Unit 44
- 179 E Lake Ridge Dr Unit 34