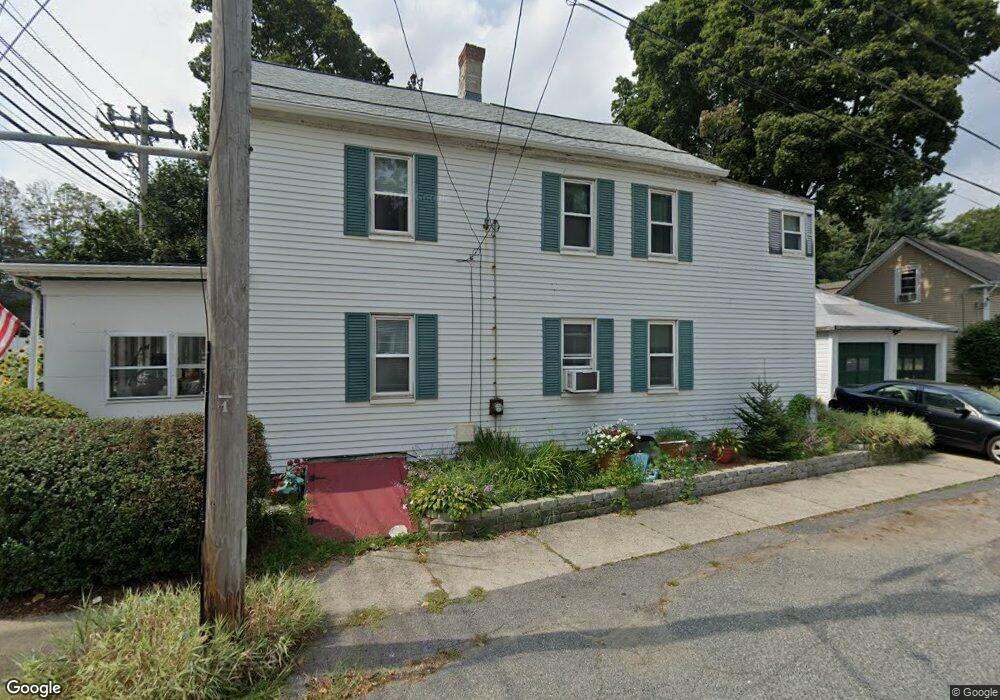
156 E Main St Marlborough, MA 01752
Estimated Value: $408,000 - $533,000
3
Beds
2
Baths
1,744
Sq Ft
$274/Sq Ft
Est. Value
About This Home
This home is located at 156 E Main St, Marlborough, MA 01752 and is currently estimated at $477,027, approximately $273 per square foot. 156 E Main St is a home located in Middlesex County with nearby schools including Marlborough High School, New Covenant Christian School, and Glenhaven Academy - JRI School.
Ownership History
Date
Name
Owned For
Owner Type
Purchase Details
Closed on
Jan 30, 1996
Sold by
Oates Stephen F and Oates Luann M
Bought by
Lucas Paul A and Lucas Frances M
Current Estimated Value
Home Financials for this Owner
Home Financials are based on the most recent Mortgage that was taken out on this home.
Original Mortgage
$87,832
Interest Rate
7.13%
Mortgage Type
Purchase Money Mortgage
Create a Home Valuation Report for This Property
The Home Valuation Report is an in-depth analysis detailing your home's value as well as a comparison with similar homes in the area
Home Values in the Area
Average Home Value in this Area
Purchase History
| Date | Buyer | Sale Price | Title Company |
|---|---|---|---|
| Lucas Paul A | $89,900 | -- |
Source: Public Records
Mortgage History
| Date | Status | Borrower | Loan Amount |
|---|---|---|---|
| Open | Lucas Paul A | $35,000 | |
| Closed | Lucas Paul A | $17,500 | |
| Open | Lucas Paul A | $90,200 | |
| Closed | Lucas Paul A | $87,832 |
Source: Public Records
Tax History
| Year | Tax Paid | Tax Assessment Tax Assessment Total Assessment is a certain percentage of the fair market value that is determined by local assessors to be the total taxable value of land and additions on the property. | Land | Improvement |
|---|---|---|---|---|
| 2025 | $3,539 | $358,900 | $146,900 | $212,000 |
| 2024 | $3,446 | $336,500 | $133,600 | $202,900 |
| 2023 | $3,507 | $303,900 | $99,100 | $204,800 |
| 2022 | $3,437 | $262,000 | $94,400 | $167,600 |
| 2021 | $3,279 | $237,600 | $74,600 | $163,000 |
| 2020 | $3,240 | $228,500 | $72,700 | $155,800 |
| 2019 | $3,160 | $224,600 | $71,200 | $153,400 |
| 2018 | $3,015 | $206,100 | $72,900 | $133,200 |
| 2017 | $2,888 | $188,500 | $72,900 | $115,600 |
| 2016 | $2,873 | $187,300 | $72,900 | $114,400 |
| 2015 | $3,122 | $198,100 | $76,400 | $121,700 |
Source: Public Records
Map
Nearby Homes
Your Personal Tour Guide
Ask me questions while you tour the home.