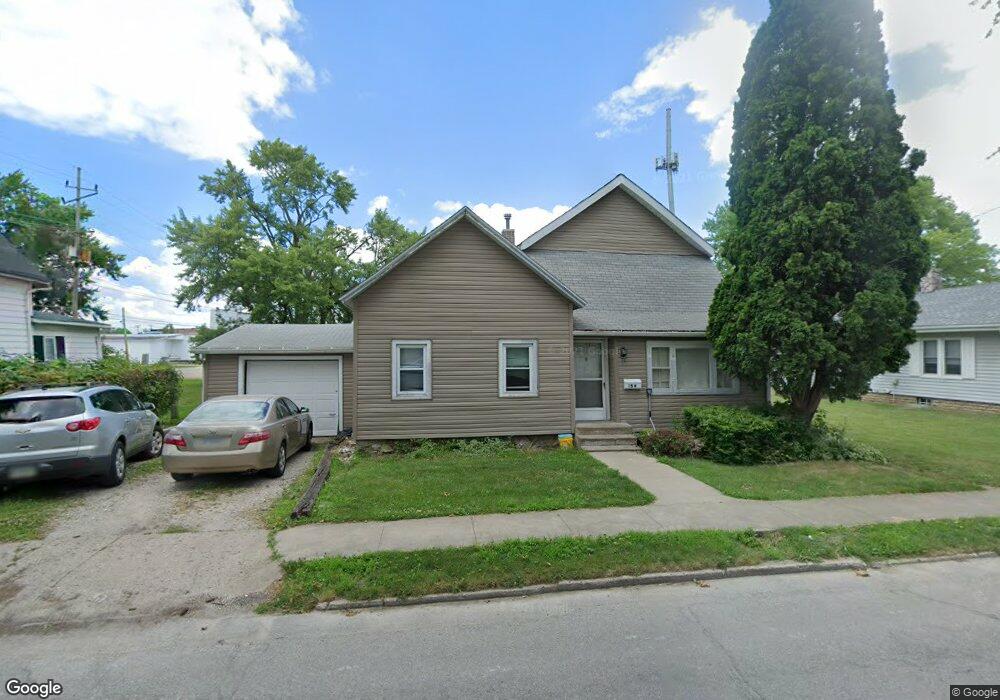
156 E Randolph St Unit SE of Downtown Nappanee, IN 46550
Estimated Value: $207,443 - $215,000
3
Beds
2
Baths
2,864
Sq Ft
$74/Sq Ft
Est. Value
About This Home
This home is located at 156 E Randolph St Unit SE of Downtown, Nappanee, IN 46550 and is currently estimated at $211,361, approximately $73 per square foot. 156 E Randolph St Unit SE of Downtown is a home located in Elkhart County with nearby schools including NorthWood High School, South Side Christian School, and Sunny Meadow Amish School.
Ownership History
Date
Name
Owned For
Owner Type
Purchase Details
Closed on
Aug 26, 2009
Sold by
Fannie Mae
Bought by
Masuku Bhekithemba and Masuku April
Current Estimated Value
Home Financials for this Owner
Home Financials are based on the most recent Mortgage that was taken out on this home.
Original Mortgage
$47,180
Outstanding Balance
$31,059
Interest Rate
5.32%
Mortgage Type
New Conventional
Estimated Equity
$180,302
Purchase Details
Closed on
May 27, 2009
Sold by
1St Source Bank
Bought by
Federal National Mortgage Association
Purchase Details
Closed on
Aug 18, 2003
Sold by
Nelson Darin W and Nelson Susan K
Bought by
Hoffer Darrel L and Hoffer Inez A
Home Financials for this Owner
Home Financials are based on the most recent Mortgage that was taken out on this home.
Original Mortgage
$74,700
Interest Rate
5.47%
Mortgage Type
Purchase Money Mortgage
Create a Home Valuation Report for This Property
The Home Valuation Report is an in-depth analysis detailing your home's value as well as a comparison with similar homes in the area
Home Values in the Area
Average Home Value in this Area
Purchase History
| Date | Buyer | Sale Price | Title Company |
|---|---|---|---|
| Masuku Bhekithemba | -- | Meridian Title Corp | |
| Federal National Mortgage Association | -- | None Available | |
| 1St Source Bank | $80,942 | None Available | |
| Hoffer Darrel L | -- | -- |
Source: Public Records
Mortgage History
| Date | Status | Borrower | Loan Amount |
|---|---|---|---|
| Open | Masuku Bhekithemba | $47,180 | |
| Previous Owner | Hoffer Darrel L | $74,700 |
Source: Public Records
Tax History Compared to Growth
Tax History
| Year | Tax Paid | Tax Assessment Tax Assessment Total Assessment is a certain percentage of the fair market value that is determined by local assessors to be the total taxable value of land and additions on the property. | Land | Improvement |
|---|---|---|---|---|
| 2024 | $1,619 | $169,800 | $13,200 | $156,600 |
| 2022 | $1,619 | $147,500 | $13,200 | $134,300 |
| 2021 | $1,228 | $118,700 | $13,200 | $105,500 |
| 2020 | $1,160 | $112,000 | $13,200 | $98,800 |
| 2019 | $983 | $99,000 | $13,200 | $85,800 |
| 2018 | $865 | $92,100 | $13,400 | $78,700 |
| 2017 | $764 | $86,400 | $13,400 | $73,000 |
| 2016 | $736 | $86,400 | $13,400 | $73,000 |
| 2014 | $635 | $78,900 | $13,400 | $65,500 |
| 2013 | $666 | $78,900 | $13,400 | $65,500 |
Source: Public Records
Map
Nearby Homes
- 555 S Madison St
- 152 N Hartman St
- 751 S Locke St
- 608 E Lincoln St
- 401 W Indiana Ave
- 251 N Locke St
- 525 Miller's Ct
- 553 E Broad St
- 357 N Main St
- 501 Pleasant Acres Dr
- 754 W Market St
- 701 N Elm St
- 556 Broad Ave
- 205 Highland St
- VL US Highway 6
- 901 Northwood Dr
- 263 Wellview Ct Unit 26
- 507 Buffalo Ct
- 652 Bungalow Dr
- 72355 County Road 3
- 156 E Randolph St
- 152 E Randolph St
- 158 E Randolph St
- 157 E Randolph St
- 355 S Main St
- 151 E Randolph St
- 313 S Main St
- 401 S Elm St
- 311 S Main St
- 107 E Randolph St
- 406 S Elm St
- 309 S Main St
- 207 E Randolph St
- 401 S Main St
- 405 S Main St
- 405 S Elm St
- 452 S Elm St
- 407 S Main St
- 454 S Elm St
- 451 S Elm St