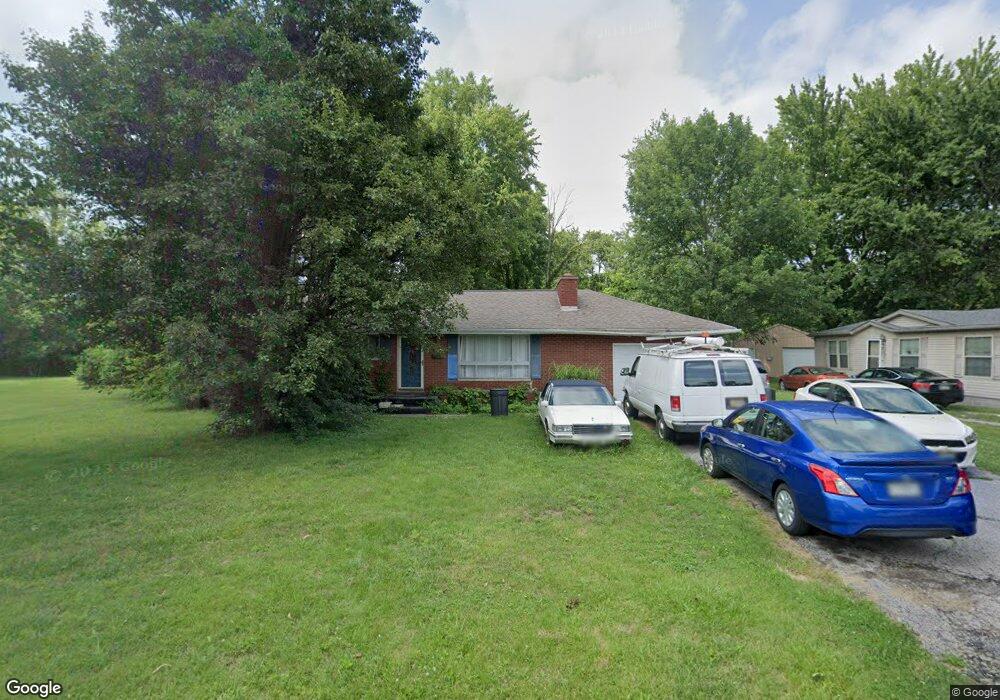
156 Factory Dr Austin, IN 47102
Estimated Value: $121,000 - $152,000
3
Beds
1
Bath
1,106
Sq Ft
$126/Sq Ft
Est. Value
About This Home
This home is located at 156 Factory Dr, Austin, IN 47102 and is currently estimated at $139,146, approximately $125 per square foot. 156 Factory Dr is a home located in Scott County with nearby schools including Austin Elementary School, Austin Middle School, and Austin High School.
Ownership History
Date
Name
Owned For
Owner Type
Purchase Details
Closed on
May 16, 2014
Sold by
Roberts Donnie and Roberts Sandra
Bought by
Roberts & Roberts Rentals Llc
Current Estimated Value
Purchase Details
Closed on
Mar 28, 2008
Sold by
Bank Of New York
Bought by
Roberts Donnie and Roberts Sandra K
Purchase Details
Closed on
Oct 25, 2007
Sold by
Lizenby John C Sheriff
Bought by
Bank Of New York
Purchase Details
Closed on
Oct 2, 2007
Sold by
Kidd Pamela J
Bought by
Bank Of New York
Purchase Details
Closed on
Nov 23, 2005
Sold by
Kidd Pamela J
Bought by
Kidd Pamela J
Home Financials for this Owner
Home Financials are based on the most recent Mortgage that was taken out on this home.
Original Mortgage
$62,050
Interest Rate
6.62%
Mortgage Type
Adjustable Rate Mortgage/ARM
Create a Home Valuation Report for This Property
The Home Valuation Report is an in-depth analysis detailing your home's value as well as a comparison with similar homes in the area
Home Values in the Area
Average Home Value in this Area
Purchase History
| Date | Buyer | Sale Price | Title Company |
|---|---|---|---|
| Roberts & Roberts Rentals Llc | -- | None Available | |
| Roberts Donnie | -- | Investors Titlecorp | |
| Bank Of New York | $40,500 | -- | |
| Bank Of New York | $40,500 | None Available | |
| Kidd Pamela J | -- | None Available |
Source: Public Records
Mortgage History
| Date | Status | Borrower | Loan Amount |
|---|---|---|---|
| Previous Owner | Kidd Pamela J | $62,050 |
Source: Public Records
Tax History Compared to Growth
Tax History
| Year | Tax Paid | Tax Assessment Tax Assessment Total Assessment is a certain percentage of the fair market value that is determined by local assessors to be the total taxable value of land and additions on the property. | Land | Improvement |
|---|---|---|---|---|
| 2024 | $1,427 | $58,200 | $8,100 | $50,100 |
| 2023 | $1,507 | $57,000 | $9,500 | $47,500 |
| 2022 | $1,241 | $56,200 | $9,500 | $46,700 |
| 2021 | $1,087 | $52,500 | $9,500 | $43,000 |
| 2020 | $1,050 | $52,500 | $9,500 | $43,000 |
| 2019 | $1,050 | $52,500 | $9,500 | $43,000 |
| 2018 | $1,134 | $56,700 | $9,500 | $47,200 |
| 2017 | $1,132 | $56,600 | $9,500 | $47,100 |
| 2016 | $1,084 | $54,200 | $9,500 | $44,700 |
| 2014 | $1,107 | $55,100 | $11,200 | $43,900 |
| 2013 | $1,107 | $58,700 | $11,200 | $47,500 |
Source: Public Records
Map
Nearby Homes