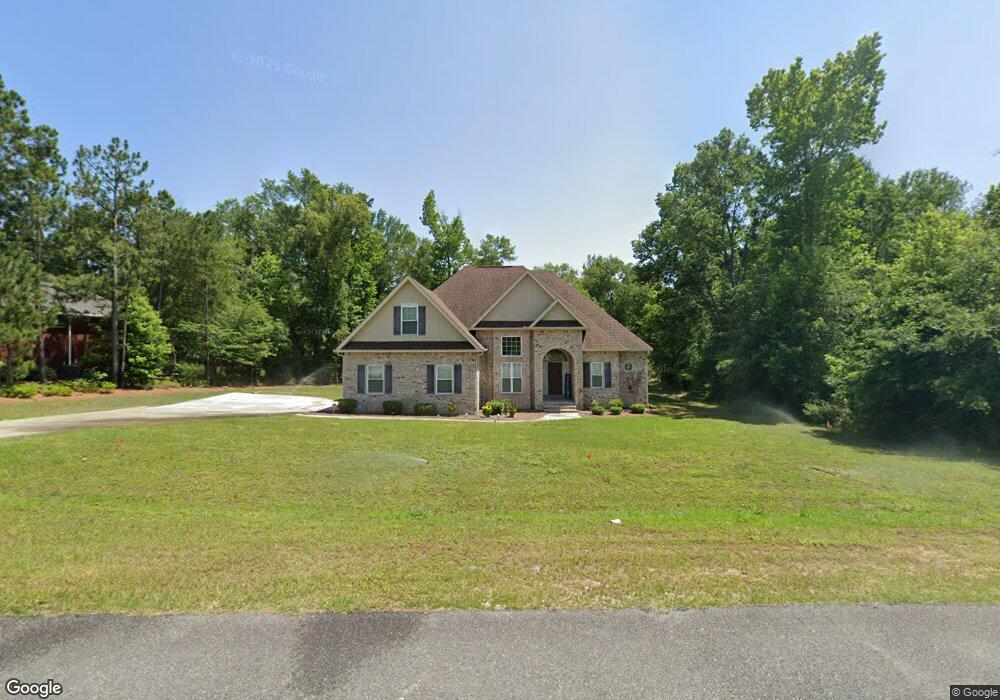
156 Hidden Creek Cir Unit 107 Lizella, GA 31052
Estimated Value: $367,000 - $394,000
4
Beds
3
Baths
2,480
Sq Ft
$153/Sq Ft
Est. Value
About This Home
This home is located at 156 Hidden Creek Cir Unit 107, Lizella, GA 31052 and is currently estimated at $379,641, approximately $153 per square foot. 156 Hidden Creek Cir Unit 107 is a home located in Bibb County with nearby schools including Skyview Elementary School, Rutland Middle School, and Rutland High School.
Ownership History
Date
Name
Owned For
Owner Type
Purchase Details
Closed on
May 3, 2017
Sold by
Thurman Wilbert
Bought by
Andrews Sneed Kelvin J and Andrews Sneed Tamica
Current Estimated Value
Home Financials for this Owner
Home Financials are based on the most recent Mortgage that was taken out on this home.
Original Mortgage
$220,797
Outstanding Balance
$183,620
Interest Rate
4.1%
Mortgage Type
VA
Estimated Equity
$196,021
Purchase Details
Closed on
Jul 26, 2016
Bought by
Thurman Wilbert
Purchase Details
Closed on
Aug 25, 2014
Sold by
Jackson Sulochana
Bought by
Rose Of Sharon Church Inc
Purchase Details
Closed on
Aug 11, 2010
Sold by
Jackson Francis and Jackson Sulochana
Bought by
Rose Of Sharon Church Inc
Purchase Details
Closed on
Dec 3, 2004
Sold by
Cumby Jason M
Bought by
Jackson Francis and Jackson Sulochana
Purchase Details
Closed on
Oct 31, 2003
Create a Home Valuation Report for This Property
The Home Valuation Report is an in-depth analysis detailing your home's value as well as a comparison with similar homes in the area
Home Values in the Area
Average Home Value in this Area
Purchase History
| Date | Buyer | Sale Price | Title Company |
|---|---|---|---|
| Andrews Sneed Kelvin J | $216,150 | -- | |
| Thurman Wilbert | $18,500 | -- | |
| Rose Of Sharon Church Inc | -- | None Available | |
| Rose Of Sharon Church Inc | -- | -- | |
| Jackson Francis | $23,500 | -- | |
| -- | $23,000 | -- |
Source: Public Records
Mortgage History
| Date | Status | Borrower | Loan Amount |
|---|---|---|---|
| Open | Andrews Sneed Kelvin J | $220,797 |
Source: Public Records
Tax History Compared to Growth
Tax History
| Year | Tax Paid | Tax Assessment Tax Assessment Total Assessment is a certain percentage of the fair market value that is determined by local assessors to be the total taxable value of land and additions on the property. | Land | Improvement |
|---|---|---|---|---|
| 2024 | $813 | $149,044 | $12,000 | $137,044 |
| 2023 | $465 | $146,276 | $12,000 | $134,276 |
| 2022 | $737 | $123,039 | $10,350 | $112,689 |
| 2021 | $272 | $108,052 | $9,450 | $98,602 |
| 2020 | $359 | $99,601 | $9,450 | $90,151 |
| 2019 | $356 | $94,731 | $9,000 | $85,731 |
| 2018 | $4,962 | $79,767 | $9,000 | $70,767 |
| 2017 | $1,770 | $38,886 | $9,000 | $29,886 |
| 2016 | $311 | $9,000 | $9,000 | $0 |
| 2015 | $441 | $9,000 | $9,000 | $0 |
| 2014 | $63 | $9,000 | $9,000 | $0 |
Source: Public Records
Map
Nearby Homes
- 169 Hidden Creek Cir
- 132 Hidden Creek Cir
- 169 Doublegate Dr
- 173 Doublegate Dr
- 177 Doublegate Dr
- 181 Doublegate Dr
- 6408 Michael Dr
- 312 Woodmont Ct
- 148 Marcar Rd
- 6219 Clayts Cir
- 218 Jason Way
- 5845 Mount Pleasant Church Rd
- 2 Longleaf Estates Rd
- 155 Shetland Pines Dr
- 6100 Clayts Cir
- 7241 Winterberry Cir
- 7253 Winterberry Cir
- 7209 Winterberry Cir
- 7216 Winterberry Cir
- 156 Hidden Creek Cir
- 164 Hidden Creek Cir
- 148 Hidden Creek Cir
- 148 Hidden Lake Cir
- 612 Cobblestone Ct
- 172 Hidden Creek Cir
- 140 Hidden Creek Cir
- 188 Hidden Creek Cir
- 200 Hidden Creek Cir
- 173 Hidden Creek Cir
- 608 Cobblestone Ct
- 165 Hidden Creek Cir
- 609 Cobblestone Ct
- 204 Hidden Creek Cir
- 136 Hidden Creek Cir
- 500 Shoals Ct
- 161 Hidden Creek Cir
- 604 Cobblestone Ct
- 601 Cobblestone Ct
- 210 Hidden Creek Cir