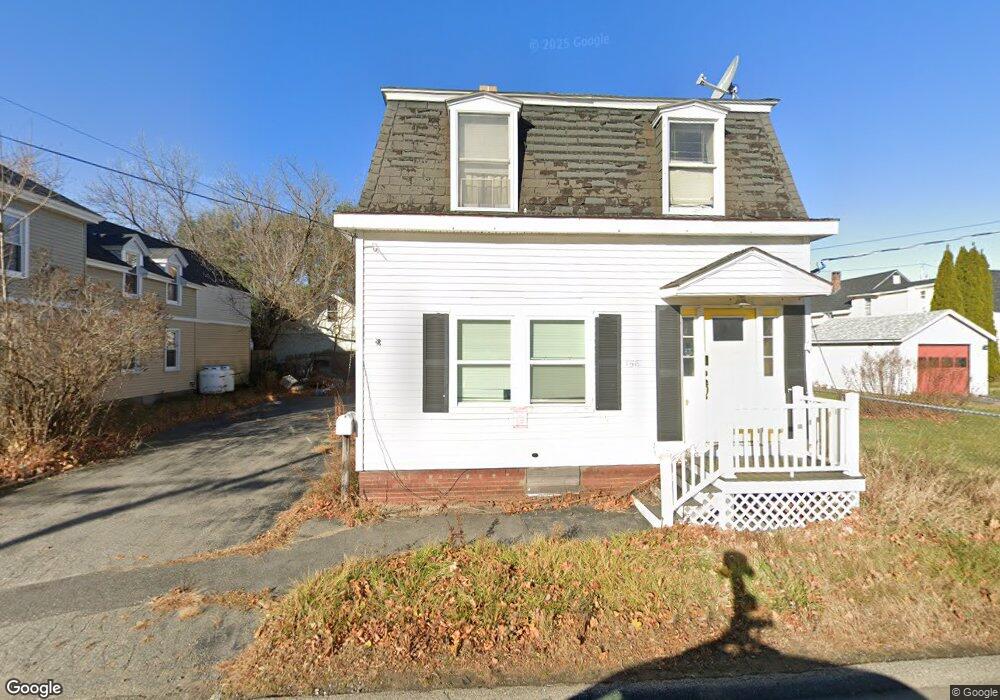
156 Hill St Biddeford, ME 04005
Estimated Value: $409,000 - $425,000
3
Beds
2
Baths
1,904
Sq Ft
$219/Sq Ft
Est. Value
About This Home
This home is located at 156 Hill St, Biddeford, ME 04005 and is currently estimated at $417,533, approximately $219 per square foot. 156 Hill St is a home located in York County with nearby schools including John F Kennedy Memorial School, Biddeford Primary School, and Biddeford Intermediate School.
Ownership History
Date
Name
Owned For
Owner Type
Purchase Details
Closed on
Oct 25, 2016
Sold by
Scribner Deena and Presby David E
Bought by
Presby David E and Presby Deena
Current Estimated Value
Home Financials for this Owner
Home Financials are based on the most recent Mortgage that was taken out on this home.
Original Mortgage
$168,500
Interest Rate
3.44%
Mortgage Type
New Conventional
Purchase Details
Closed on
Sep 9, 2005
Sold by
Presby David E
Bought by
Scribner Deena and Presby David E
Create a Home Valuation Report for This Property
The Home Valuation Report is an in-depth analysis detailing your home's value as well as a comparison with similar homes in the area
Home Values in the Area
Average Home Value in this Area
Purchase History
| Date | Buyer | Sale Price | Title Company |
|---|---|---|---|
| Presby David E | -- | -- | |
| Scribner Deena | -- | -- |
Source: Public Records
Mortgage History
| Date | Status | Borrower | Loan Amount |
|---|---|---|---|
| Closed | Presby David E | $168,500 |
Source: Public Records
Tax History Compared to Growth
Tax History
| Year | Tax Paid | Tax Assessment Tax Assessment Total Assessment is a certain percentage of the fair market value that is determined by local assessors to be the total taxable value of land and additions on the property. | Land | Improvement |
|---|---|---|---|---|
| 2024 | $4,327 | $304,300 | $121,600 | $182,700 |
| 2023 | $3,992 | $304,300 | $121,600 | $182,700 |
| 2022 | $3,917 | $238,700 | $63,100 | $175,600 |
| 2021 | $3,630 | $199,100 | $52,600 | $146,500 |
| 2020 | $3,573 | $178,200 | $44,700 | $133,500 |
| 2019 | $4,036 | $178,200 | $44,700 | $133,500 |
| 2018 | $3,511 | $178,200 | $44,700 | $133,500 |
| 2017 | $3,480 | $173,400 | $44,700 | $128,700 |
| 2016 | $3,444 | $173,400 | $44,700 | $128,700 |
| 2015 | $3,065 | $173,400 | $44,700 | $128,700 |
| 2014 | $2,989 | $173,400 | $44,700 | $128,700 |
| 2013 | -- | $184,900 | $54,000 | $130,900 |
Source: Public Records
Map
Nearby Homes