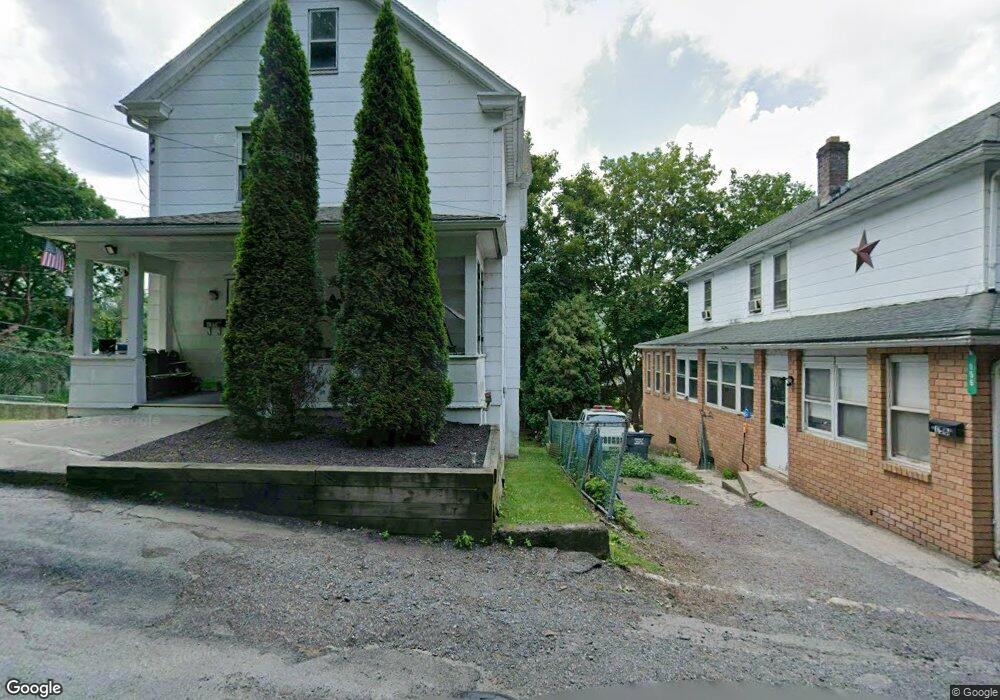
156 Loggie Rd Nesquehoning, PA 18240
Estimated Value: $127,178 - $156,000
3
Beds
1
Bath
1,260
Sq Ft
$114/Sq Ft
Est. Value
About This Home
This home is located at 156 Loggie Rd, Nesquehoning, PA 18240 and is currently estimated at $144,045, approximately $114 per square foot. 156 Loggie Rd is a home located in Carbon County with nearby schools including Panther Valley Elementary School, Panther Valley Intermediate School, and Panther Valley Junior/Senior High School.
Ownership History
Date
Name
Owned For
Owner Type
Purchase Details
Closed on
Nov 13, 2017
Sold by
Kraus Randy M and Kraus Sara N
Bought by
Koenitzer Randy M
Current Estimated Value
Purchase Details
Closed on
Mar 14, 2014
Sold by
Jim Thorpe Neighborhood Bank
Bought by
Kraus Randy M and Kraus Sara N
Home Financials for this Owner
Home Financials are based on the most recent Mortgage that was taken out on this home.
Original Mortgage
$1,100
Interest Rate
4.27%
Mortgage Type
Unknown
Purchase Details
Closed on
Jun 29, 2012
Sold by
Stradling Betty Lou and Levy Paul J
Bought by
The Jim Thorpe National Bank
Purchase Details
Closed on
Jan 26, 2007
Sold by
Weicker Ray and Weicker Michelina Eva
Bought by
Davidson Harry
Home Financials for this Owner
Home Financials are based on the most recent Mortgage that was taken out on this home.
Original Mortgage
$58,400
Interest Rate
6.15%
Mortgage Type
New Conventional
Create a Home Valuation Report for This Property
The Home Valuation Report is an in-depth analysis detailing your home's value as well as a comparison with similar homes in the area
Home Values in the Area
Average Home Value in this Area
Purchase History
| Date | Buyer | Sale Price | Title Company |
|---|---|---|---|
| Koenitzer Randy M | -- | None Available | |
| Kraus Randy M | $55,000 | None Available | |
| The Jim Thorpe National Bank | $1,076 | None Available | |
| Davidson Harry | $73,000 | None Available |
Source: Public Records
Mortgage History
| Date | Status | Borrower | Loan Amount |
|---|---|---|---|
| Previous Owner | Kraus Randy M | $1,100 | |
| Previous Owner | Kraus Randy M | $53,978 | |
| Previous Owner | Davidson Harry | $58,400 |
Source: Public Records
Tax History Compared to Growth
Tax History
| Year | Tax Paid | Tax Assessment Tax Assessment Total Assessment is a certain percentage of the fair market value that is determined by local assessors to be the total taxable value of land and additions on the property. | Land | Improvement |
|---|---|---|---|---|
| 2025 | $2,211 | $23,397 | $4,050 | $19,347 |
| 2024 | $2,301 | $23,397 | $4,050 | $19,347 |
| 2023 | $2,255 | $23,397 | $4,050 | $19,347 |
| 2022 | $2,269 | $23,397 | $4,050 | $19,347 |
| 2021 | $2,269 | $23,397 | $4,050 | $19,347 |
| 2020 | $2,234 | $23,397 | $4,050 | $19,347 |
| 2019 | $2,105 | $23,397 | $4,050 | $19,347 |
| 2018 | $2,082 | $23,397 | $4,050 | $19,347 |
| 2017 | $2,082 | $23,397 | $4,050 | $19,347 |
| 2016 | -- | $23,397 | $4,050 | $19,347 |
| 2015 | -- | $23,397 | $4,050 | $19,347 |
| 2014 | -- | $23,397 | $4,050 | $19,347 |
Source: Public Records
Map
Nearby Homes
- 153 W High St
- 229 W High St
- 134 W Railroad St Unit 136
- 1 W High St
- 2 W Catawissa St
- 158162 Coal St
- 41 E Catawissa St
- 61 Rhume St
- 34 Coal St
- 142 E Center St
- 142 E Catawissa St
- 58 W Columbus Ave
- 24 W Garibaldi Ave
- 20 W Garibaldi Ave
- 105 E Columbus Ave
- 117 E Garibaldi Ave
- 116 Spruce St
- 129 Lentz Trail
- 0 11th Ave Unit PM-131093
- 0 Birch Dr Unit 759990
- 133 W Ridge St
- 123 W Ridge St Unit 125
- 137 W Ridge St
- 139 W Ridge St
- 135 W Ridge St
- 119 W Ridge St
- 159 W Ridge St
- 141 W Ridge St
- 115 W Ridge St
- 161 Loggie Rd
- 113 W Ridge St
- 111 W Ridge St
- 113 -115 W Ridge St
- 201 W Ridge St
- 107 W Ridge St
- W Ridge St
- 203 W Ridge St
- 105 W Ridge St
- 109 W Ridge St
- 101 W Ridge St