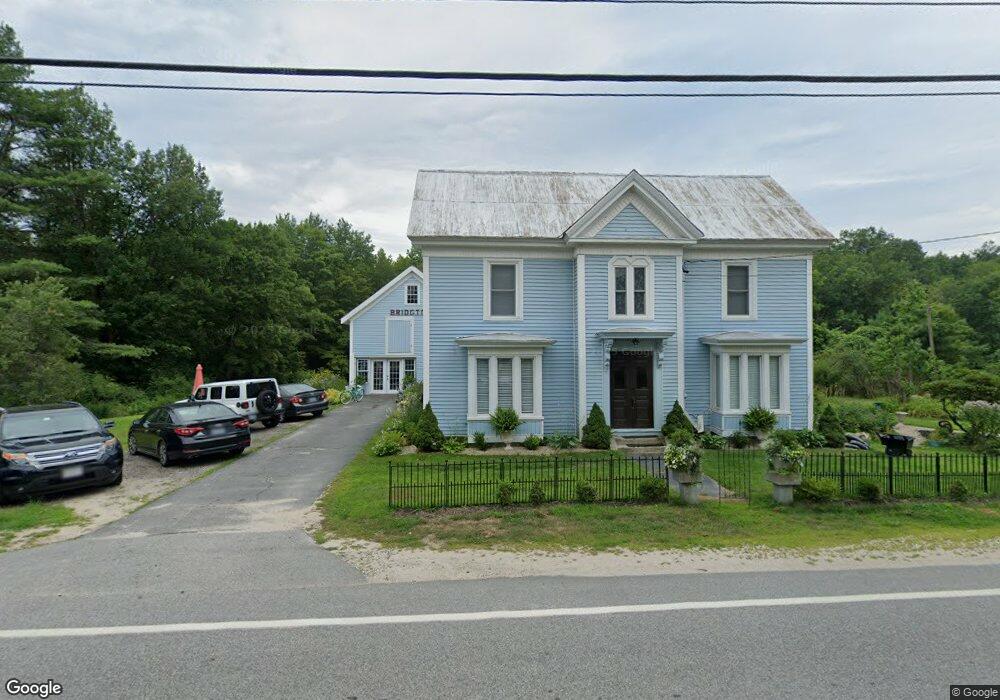
156 Main St Bridgton, ME 04009
Estimated Value: $387,000
3
Beds
1
Bath
2,240
Sq Ft
$173/Sq Ft
Est. Value
About This Home
This home is located at 156 Main St, Bridgton, ME 04009 and is currently estimated at $387,000, approximately $172 per square foot. 156 Main St is a home located in Cumberland County with nearby schools including Lake Region High School and Bridgton Academy.
Ownership History
Date
Name
Owned For
Owner Type
Purchase Details
Closed on
Apr 4, 2017
Sold by
Allen Mark W and Allen Sonya A
Bought by
Homestead Farm Group
Current Estimated Value
Purchase Details
Closed on
Jul 9, 2015
Sold by
Winterford Ent Llc
Bought by
Allen Mark W and Allen Sonya A
Purchase Details
Closed on
Dec 26, 2006
Sold by
Keith Margaret W and Lee Sharon K
Bought by
Fish Sandra D and Fish William N
Create a Home Valuation Report for This Property
The Home Valuation Report is an in-depth analysis detailing your home's value as well as a comparison with similar homes in the area
Home Values in the Area
Average Home Value in this Area
Purchase History
| Date | Buyer | Sale Price | Title Company |
|---|---|---|---|
| Homestead Farm Group | -- | -- | |
| Allen Mark W | -- | -- | |
| Fish Sandra D | -- | -- |
Source: Public Records
Tax History Compared to Growth
Tax History
| Year | Tax Paid | Tax Assessment Tax Assessment Total Assessment is a certain percentage of the fair market value that is determined by local assessors to be the total taxable value of land and additions on the property. | Land | Improvement |
|---|---|---|---|---|
| 2024 | $3,001 | $175,991 | $39,080 | $136,911 |
| 2023 | $3,027 | $175,991 | $39,080 | $136,911 |
| 2022 | $2,675 | $175,991 | $39,080 | $136,911 |
| 2021 | $2,605 | $175,991 | $39,080 | $136,911 |
| 2020 | $2,631 | $175,991 | $39,080 | $136,911 |
| 2019 | $2,640 | $175,991 | $39,080 | $136,911 |
| 2018 | $2,605 | $175,991 | $39,080 | $136,911 |
| 2017 | $2,643 | $175,991 | $39,080 | $136,911 |
| 2016 | $2,613 | $175,991 | $39,080 | $136,911 |
| 2015 | $1,899 | $138,113 | $44,760 | $93,353 |
| 2014 | $1,942 | $138,113 | $44,760 | $93,353 |
Source: Public Records
Map
Nearby Homes
- 20 Bennett St
- 3 Fowler St
- 6 School St
- 10 Gallinari Way
- 0 Tuttle Ln Unit 1628227
- 220 S High St
- 70 Plummers Landing Rd
- 209 Portland Rd
- 4 C St
- 3 A St
- 236 Portland Rd Unit A
- 222 N High St
- 26 Middle Ridge Rd
- 7 Elysian Way
- Lot 23 G Smally Way
- 11 Sweden Rd
- Lot 23 - F Smally Way
- Lot 23 - D Smally Way
- 10 Hebb Dr
- 27 Stonehedge Dr