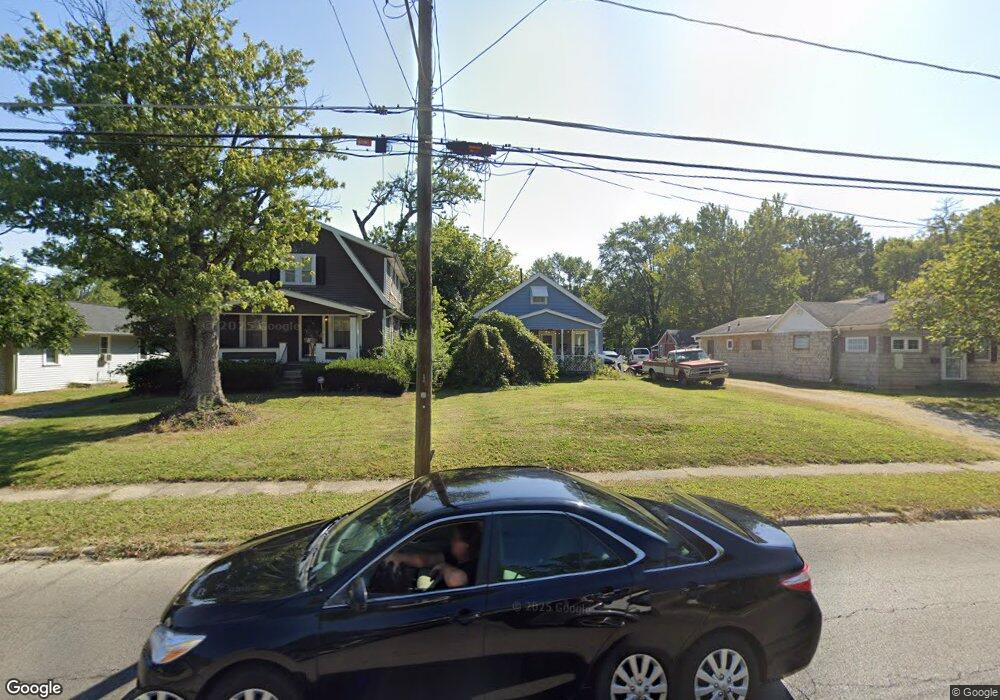
156 Maplewood Ave Columbus, OH 43213
Estimated Value: $160,308 - $181,000
3
Beds
1
Bath
1,047
Sq Ft
$163/Sq Ft
Est. Value
About This Home
This home is located at 156 Maplewood Ave, Columbus, OH 43213 and is currently estimated at $171,077, approximately $163 per square foot. 156 Maplewood Ave is a home located in Franklin County with nearby schools including Beechwood Elementary School, Etna Road Elementary School, and Rosemore Middle School.
Ownership History
Date
Name
Owned For
Owner Type
Purchase Details
Closed on
Jul 31, 2009
Sold by
Smith Karen and 156 Maplewood Ave Land Trust
Bought by
Fletcher Robert and Fletcher Rhonda L
Current Estimated Value
Purchase Details
Closed on
Jan 23, 2009
Sold by
Fuller Michael and Fuller Lori A
Bought by
Smith Karen and 156 Maplewood Ave Land Trust F
Purchase Details
Closed on
Nov 26, 2001
Sold by
Fuller Lori A
Bought by
Fuller Michael and Fuller Lori A
Home Financials for this Owner
Home Financials are based on the most recent Mortgage that was taken out on this home.
Original Mortgage
$62,050
Interest Rate
8.62%
Mortgage Type
Purchase Money Mortgage
Purchase Details
Closed on
Mar 14, 1996
Sold by
Mckee Pearl
Bought by
Lori Fuller
Home Financials for this Owner
Home Financials are based on the most recent Mortgage that was taken out on this home.
Original Mortgage
$43,405
Interest Rate
7.06%
Mortgage Type
FHA
Purchase Details
Closed on
Mar 25, 1988
Create a Home Valuation Report for This Property
The Home Valuation Report is an in-depth analysis detailing your home's value as well as a comparison with similar homes in the area
Home Values in the Area
Average Home Value in this Area
Purchase History
| Date | Buyer | Sale Price | Title Company |
|---|---|---|---|
| Fletcher Robert | $12,100 | Attorney | |
| Smith Karen | -- | None Available | |
| Fuller Michael | -- | Americas Choice Title Agency | |
| Lori Fuller | $43,000 | -- | |
| -- | -- | -- |
Source: Public Records
Mortgage History
| Date | Status | Borrower | Loan Amount |
|---|---|---|---|
| Previous Owner | Fuller Michael | $62,050 | |
| Previous Owner | Lori Fuller | $43,405 |
Source: Public Records
Tax History Compared to Growth
Tax History
| Year | Tax Paid | Tax Assessment Tax Assessment Total Assessment is a certain percentage of the fair market value that is determined by local assessors to be the total taxable value of land and additions on the property. | Land | Improvement |
|---|---|---|---|---|
| 2024 | $1,865 | $42,670 | $15,580 | $27,090 |
| 2023 | $1,852 | $42,665 | $15,575 | $27,090 |
| 2022 | $1,363 | $23,870 | $6,790 | $17,080 |
| 2021 | $1,280 | $23,870 | $6,790 | $17,080 |
| 2020 | $1,267 | $23,870 | $6,790 | $17,080 |
| 2019 | $1,129 | $18,490 | $5,430 | $13,060 |
| 2018 | $1,015 | $18,490 | $5,430 | $13,060 |
| 2017 | $981 | $18,490 | $5,430 | $13,060 |
| 2016 | $871 | $13,340 | $4,830 | $8,510 |
| 2015 | $879 | $13,340 | $4,830 | $8,510 |
| 2014 | $879 | $13,340 | $4,830 | $8,510 |
| 2013 | $464 | $14,805 | $5,355 | $9,450 |
Source: Public Records
Map
Nearby Homes
- 91 Maplewood Ave
- 3814 Elbern Ave
- 178 S Weyant Ave
- 320 Collingwood Ave
- 201 S Weyant Ave
- 91 Robinwood Ave
- 88-90 N Waverly St
- 94 N Hampton Rd
- 46 N Everett Ave
- 526 Collingwood Ave
- 73 N Everett Ave
- 247 S James Rd
- 277 S James Rd
- 4148 Elbern Ave
- 239 S Kellner Rd
- 4154 Seigman Ave
- 647 S Napoleon Ave
- 253 N James Rd
- 177 N James Rd
- 243 N James Rd
- 150 Maplewood Ave
- 162 Maplewood Ave
- 144 Maplewood Ave
- 170 Maplewood Ave
- 138 Maplewood Ave
- 174 Maplewood Ave
- 159 Maplewood Ave
- 184 Maplewood Ave
- 149 Maplewood Ave
- 171 Maplewood Ave
- 145 Maplewood Ave
- 192 Maplewood Ave
- 3715 Doney St
- 118 Maplewood Ave
- 133 Maplewood Ave
- 3723 Doney St
- 198 Maplewood Ave
- 3729 Doney St
- 204 Maplewood Ave
- 201 Maplewood Ave