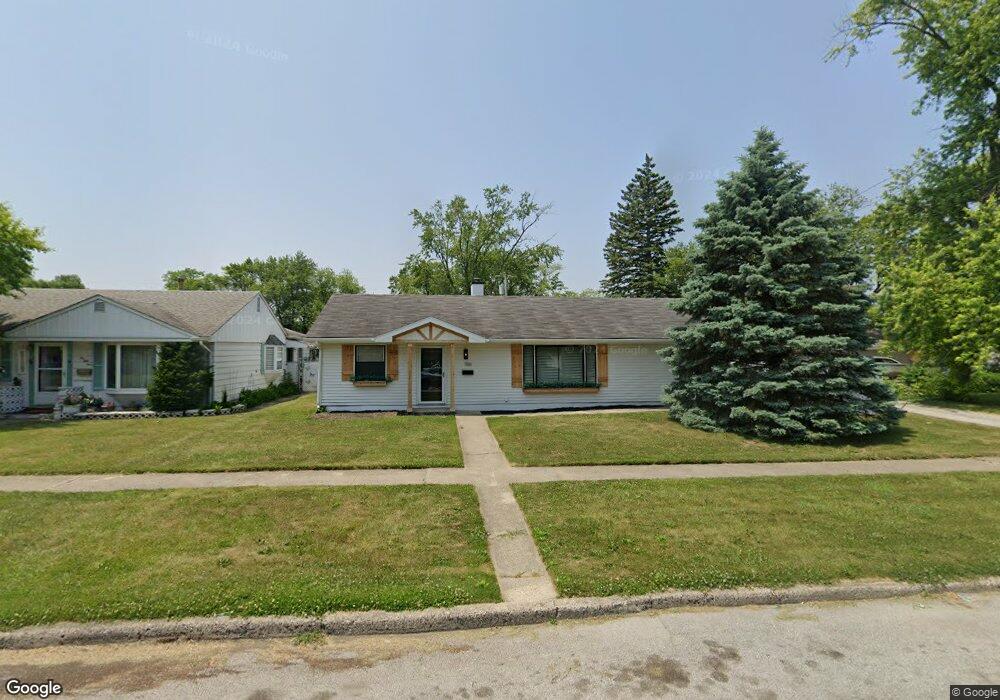
156 N Cavender St Hobart, IN 46342
Estimated Value: $213,196 - $240,000
3
Beds
2
Baths
1,375
Sq Ft
$164/Sq Ft
Est. Value
About This Home
This home is located at 156 N Cavender St, Hobart, IN 46342 and is currently estimated at $225,549, approximately $164 per square foot. 156 N Cavender St is a home located in Lake County with nearby schools including Hobart High School, Hobart Baptist School, and Trinity Lutheran School.
Ownership History
Date
Name
Owned For
Owner Type
Purchase Details
Closed on
Jul 29, 2010
Sold by
Kuznicki Jacquelyn A
Bought by
Burnett Joslyn D
Current Estimated Value
Home Financials for this Owner
Home Financials are based on the most recent Mortgage that was taken out on this home.
Original Mortgage
$110,992
Outstanding Balance
$76,851
Interest Rate
5.5%
Mortgage Type
FHA
Estimated Equity
$148,698
Purchase Details
Closed on
Jul 20, 2005
Sold by
Kuznicki Jacquelyn A
Bought by
Kuznicki Jacquelyn A
Home Financials for this Owner
Home Financials are based on the most recent Mortgage that was taken out on this home.
Original Mortgage
$165,000
Interest Rate
5.09%
Mortgage Type
FHA
Purchase Details
Closed on
Jun 23, 2005
Sold by
Kuznicki Jacquelyn A and Nosich Linda L
Bought by
Kuznicki Jacquelyn A
Home Financials for this Owner
Home Financials are based on the most recent Mortgage that was taken out on this home.
Original Mortgage
$165,000
Interest Rate
5.09%
Mortgage Type
FHA
Create a Home Valuation Report for This Property
The Home Valuation Report is an in-depth analysis detailing your home's value as well as a comparison with similar homes in the area
Home Values in the Area
Average Home Value in this Area
Purchase History
| Date | Buyer | Sale Price | Title Company |
|---|---|---|---|
| Burnett Joslyn D | -- | Meridian Title Corp | |
| Kuznicki Jacquelyn A | -- | Chicago Title Insurance Comp | |
| Kuznicki Jacquelyn A | -- | Chicago Title Insurance Comp |
Source: Public Records
Mortgage History
| Date | Status | Borrower | Loan Amount |
|---|---|---|---|
| Open | Burnett Joslyn D | $110,992 | |
| Previous Owner | Kuznicki Jacquelyn A | $165,000 | |
| Previous Owner | Kuznicki Jacquelyn A | $165,000 |
Source: Public Records
Tax History Compared to Growth
Tax History
| Year | Tax Paid | Tax Assessment Tax Assessment Total Assessment is a certain percentage of the fair market value that is determined by local assessors to be the total taxable value of land and additions on the property. | Land | Improvement |
|---|---|---|---|---|
| 2024 | $7,385 | $184,000 | $39,400 | $144,600 |
| 2023 | $2,034 | $180,900 | $40,400 | $140,500 |
| 2022 | $2,034 | $171,200 | $31,600 | $139,600 |
| 2021 | $1,838 | $154,200 | $26,400 | $127,800 |
| 2020 | $1,721 | $145,700 | $26,400 | $119,300 |
| 2019 | $1,453 | $111,000 | $26,400 | $84,600 |
| 2018 | $1,339 | $105,200 | $26,400 | $78,800 |
| 2017 | $1,451 | $103,700 | $26,400 | $77,300 |
| 2016 | $1,504 | $116,900 | $26,400 | $90,500 |
| 2014 | $1,328 | $114,800 | $26,400 | $88,400 |
| 2013 | $1,343 | $115,400 | $26,400 | $89,000 |
Source: Public Records
Map
Nearby Homes
- 305 N Delaware St
- 58 N Wilson St
- 361 N Wabash St
- 337 N Dearborn St
- 1888 W Old Ridge Rd
- 324 N Clark St
- 208 S Colorado St
- 126 S Wisconsin St
- 220 S Delaware St
- 1320 W 38th Place
- 214 N Ash St
- 1016 W 38th Place
- 918 W 38th Place
- 652 N Guyer St
- 312 W Old Ridge Rd
- 1009 Lake George Dr
- 1521 W 4th St
- 1220 W 37th Place
- 246 Crestwood Dr
- 326 S Lasalle St
- 152 N Cavender St
- 148 N Cavender St
- 145 N Guyer St
- 144 N Cavender St
- 1301 W Ridge Rd
- 141 N Guyer St
- 1303 W Old Ridge Rd
- 1303 W Old Ridge Rd
- 149 N Guyer St
- 1307 W Old Ridge Rd
- 137 N Guyer St
- 1219 W Old Rd
- 140 N Cavender St
- 157 N Cavender St
- 1219 W Old Ridge Rd
- 1219 W Old Ridge Rd
- 153 N Cavender St
- 1313 W Old Ridge Rd
- 133 N Guyer St
- 149 N Cavender St