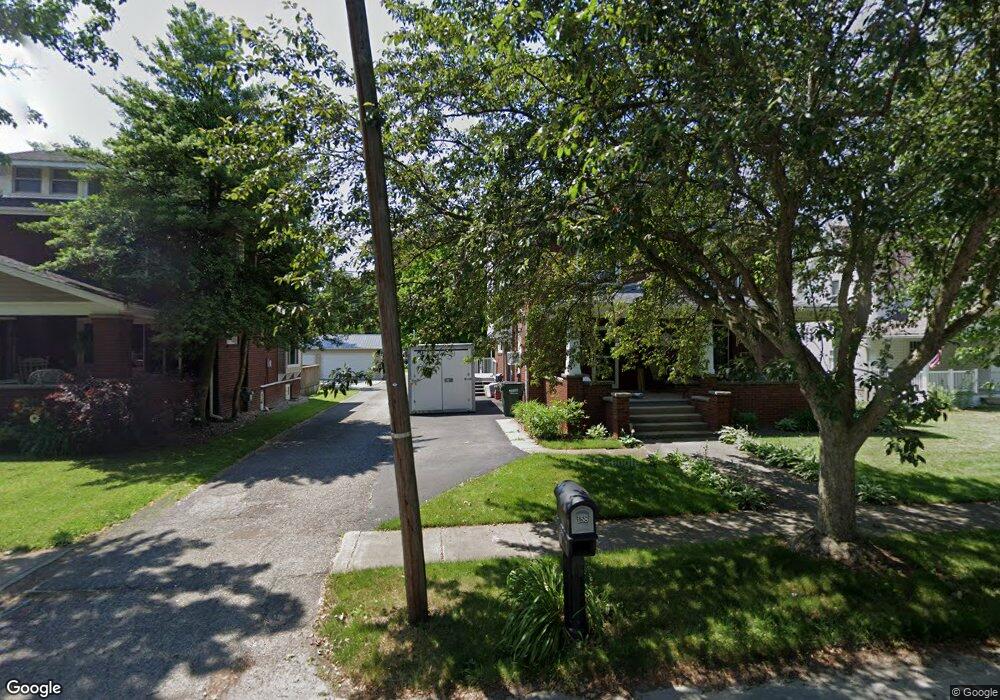
156 N Main St Creston, OH 44217
Estimated Value: $178,000 - $263,231
4
Beds
2
Baths
2,150
Sq Ft
$108/Sq Ft
Est. Value
About This Home
This home is located at 156 N Main St, Creston, OH 44217 and is currently estimated at $232,558, approximately $108 per square foot. 156 N Main St is a home located in Wayne County with nearby schools including Norwayne Elementary School, Norwayne Middle School, and Norwayne High School.
Ownership History
Date
Name
Owned For
Owner Type
Purchase Details
Closed on
Dec 20, 2012
Sold by
Eh Pooled 1012 Lp
Bought by
Valentine Dan and Valentine Wendy
Current Estimated Value
Purchase Details
Closed on
Dec 7, 2012
Sold by
The Bank Of New York Mellon
Bought by
Eh Pooled 1012 Lp
Purchase Details
Closed on
Apr 16, 2012
Sold by
Eppley Daniel and Eppley Phyllis
Bought by
The Bank Of New York Mellon
Purchase Details
Closed on
Jun 13, 2003
Sold by
Eppley Summie Cecil and Eppley Mary Ellen
Bought by
Eppley Summie Cecil and Eppley Mary Ellen
Purchase Details
Closed on
Jan 17, 1997
Sold by
Coffey John K
Bought by
Eppley Summie C and Eppley Mary E
Home Financials for this Owner
Home Financials are based on the most recent Mortgage that was taken out on this home.
Original Mortgage
$74,400
Interest Rate
7.54%
Mortgage Type
New Conventional
Create a Home Valuation Report for This Property
The Home Valuation Report is an in-depth analysis detailing your home's value as well as a comparison with similar homes in the area
Home Values in the Area
Average Home Value in this Area
Purchase History
| Date | Buyer | Sale Price | Title Company |
|---|---|---|---|
| Valentine Dan | $41,850 | None Available | |
| Eh Pooled 1012 Lp | $32,000 | Title & Abstract Reo Inc | |
| The Bank Of New York Mellon | $58,667 | Attorney | |
| Eppley Summie Cecil | -- | -- | |
| Eppley Summie C | $59,900 | -- |
Source: Public Records
Mortgage History
| Date | Status | Borrower | Loan Amount |
|---|---|---|---|
| Previous Owner | Eppley Summie C | $74,400 |
Source: Public Records
Tax History Compared to Growth
Tax History
| Year | Tax Paid | Tax Assessment Tax Assessment Total Assessment is a certain percentage of the fair market value that is determined by local assessors to be the total taxable value of land and additions on the property. | Land | Improvement |
|---|---|---|---|---|
| 2024 | $3,027 | $67,500 | $12,070 | $55,430 |
| 2023 | $3,027 | $67,500 | $12,070 | $55,430 |
| 2022 | $2,612 | $51,540 | $9,220 | $42,320 |
| 2021 | $2,382 | $51,540 | $9,220 | $42,320 |
| 2020 | $2,396 | $51,540 | $9,220 | $42,320 |
| 2019 | $2,027 | $44,230 | $9,220 | $35,010 |
| 2018 | $2,004 | $43,490 | $9,220 | $34,270 |
| 2017 | $1,828 | $43,490 | $9,220 | $34,270 |
| 2016 | $1,802 | $40,370 | $9,220 | $31,150 |
| 2015 | $1,665 | $37,680 | $9,220 | $28,460 |
| 2014 | $1,679 | $37,680 | $9,220 | $28,460 |
| 2013 | $1,725 | $37,650 | $9,120 | $28,530 |
Source: Public Records
Map
Nearby Homes
- 147 N Main St
- 10368 Wooster Pike
- 00 Sterling St
- 137 Forest View Ct
- 153 S Main St
- 0 Burbank St
- 154 Garden St
- 124 Garden St
- 5913 Stuckey Rd
- 14599 Eby Rd
- 5062 Catawba Place Ln
- 5222 Greenwich Rd Unit 2
- 9372 Towpath Trail
- 9376 Daniels Rd
- 129 Center St
- 6049 Valley Quail Ct
- 9252 Woodland Blue Dr
- 2961 Kestrell Ln
- 5833 Greenwich Rd
- 9248 Woodland Blue Dr