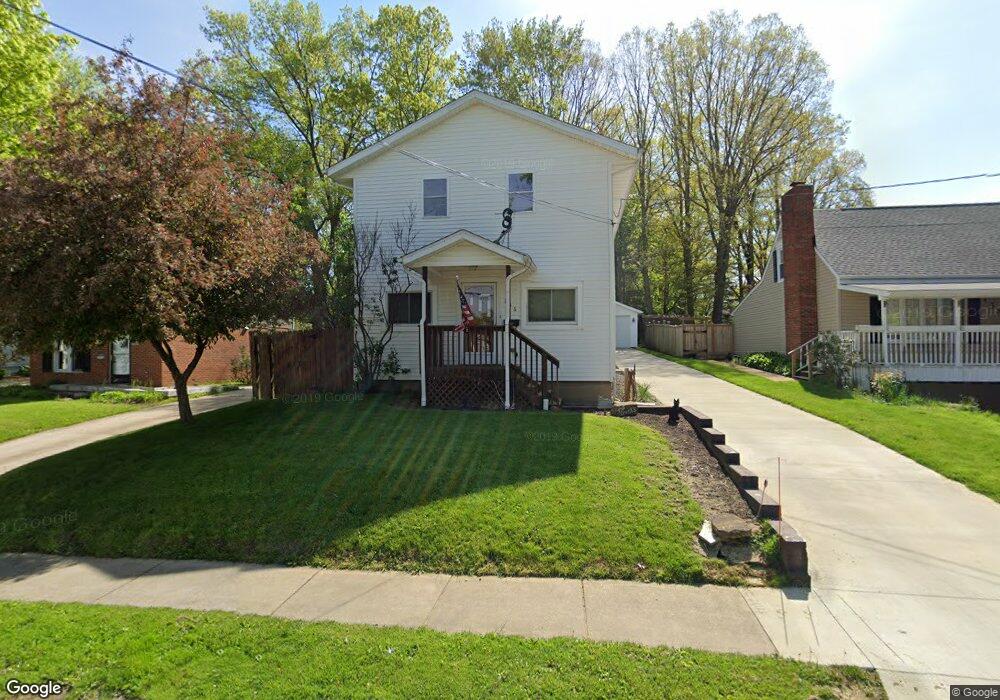
156 N Scranton St Ravenna, OH 44266
Estimated Value: $167,000 - $195,000
4
Beds
3
Baths
1,584
Sq Ft
$111/Sq Ft
Est. Value
About This Home
This home is located at 156 N Scranton St, Ravenna, OH 44266 and is currently estimated at $176,413, approximately $111 per square foot. 156 N Scranton St is a home located in Portage County with nearby schools including West Park Elementary School, West Main Elementary School, and Brown Middle School.
Ownership History
Date
Name
Owned For
Owner Type
Purchase Details
Closed on
Feb 11, 2008
Sold by
Crock Linda M
Bought by
Crock Norman M
Current Estimated Value
Purchase Details
Closed on
Jan 1, 1990
Bought by
Crock Norman and Crock Linda M
Create a Home Valuation Report for This Property
The Home Valuation Report is an in-depth analysis detailing your home's value as well as a comparison with similar homes in the area
Home Values in the Area
Average Home Value in this Area
Purchase History
| Date | Buyer | Sale Price | Title Company |
|---|---|---|---|
| Crock Norman M | -- | Attorney | |
| Crock Norman | -- | -- |
Source: Public Records
Tax History Compared to Growth
Tax History
| Year | Tax Paid | Tax Assessment Tax Assessment Total Assessment is a certain percentage of the fair market value that is determined by local assessors to be the total taxable value of land and additions on the property. | Land | Improvement |
|---|---|---|---|---|
| 2024 | $2,080 | $57,020 | $5,360 | $51,660 |
| 2023 | $1,746 | $39,210 | $5,360 | $33,850 |
| 2022 | $1,747 | $39,210 | $5,360 | $33,850 |
| 2021 | $1,749 | $39,210 | $5,360 | $33,850 |
| 2020 | $1,663 | $33,120 | $5,360 | $27,760 |
| 2019 | $1,665 | $33,120 | $5,360 | $27,760 |
| 2018 | $1,681 | $31,610 | $6,790 | $24,820 |
| 2017 | $1,681 | $31,610 | $6,790 | $24,820 |
| 2016 | $1,480 | $29,650 | $6,790 | $22,860 |
| 2015 | $1,482 | $29,650 | $6,790 | $22,860 |
| 2014 | $1,480 | $29,650 | $6,790 | $22,860 |
| 2013 | $1,471 | $29,650 | $6,790 | $22,860 |
Source: Public Records
Map
Nearby Homes
- 3505 Ohio 59 Unit 105
- 3505 Ohio 59 Unit 166
- 3505 Ohio 59 Unit 46
- 6287 Cara Dr
- 110 Oakwood St
- 856 W Main St
- 1057 W Riddle Ave
- 1024 W Riddle Ave
- 825 W Highland Ave
- 656 W Highland Ave
- 646 3rd St
- 6615 Cleveland Rd Unit K2
- 3229 Brady Lake Rd
- 208 King St
- 3461 Mabel Ave
- 6311 Roselawn Ave
- 247 King St
- 3279 State Route 59
- 6388 Marchinn Dr
- 6704 Wall St
- 150 N Scranton St
- 164 N Scranton St
- 144 N Scranton St
- 168 N Scranton St
- 157 N Scranton St
- 151 N Scranton St
- 172 N Scranton St
- 1084 Mechanic Ave
- 159 N Scranton St
- 1074 Mechanic Ave
- 147 N Scranton St
- 1072 Mechanic Ave
- 145 N Scranton St
- 143 N Scranton St
- 161 N Scranton St
- 165 N Scranton St
- 176 N Scranton St
- 130 N Scranton St
- 1066 Mechanic Ave
- 175 N Scranton St