
Seller's Agent in 2022
Claire Leblanc
Berkshire Hathaway HomeServices Commonwealth Real Estate
(781) 424-5443
1 in this area
19 Total Sales

Estimated Value: $478,000 - $591,000
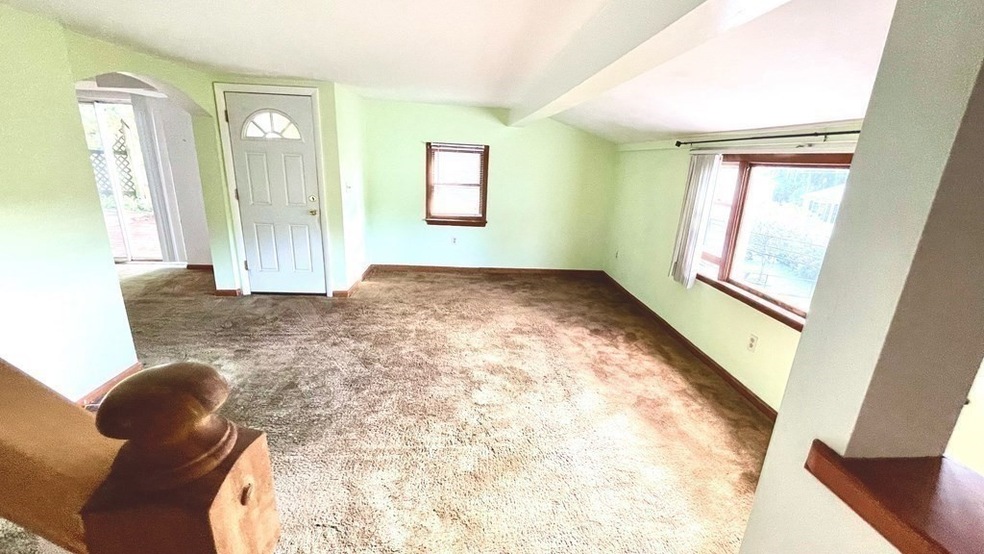
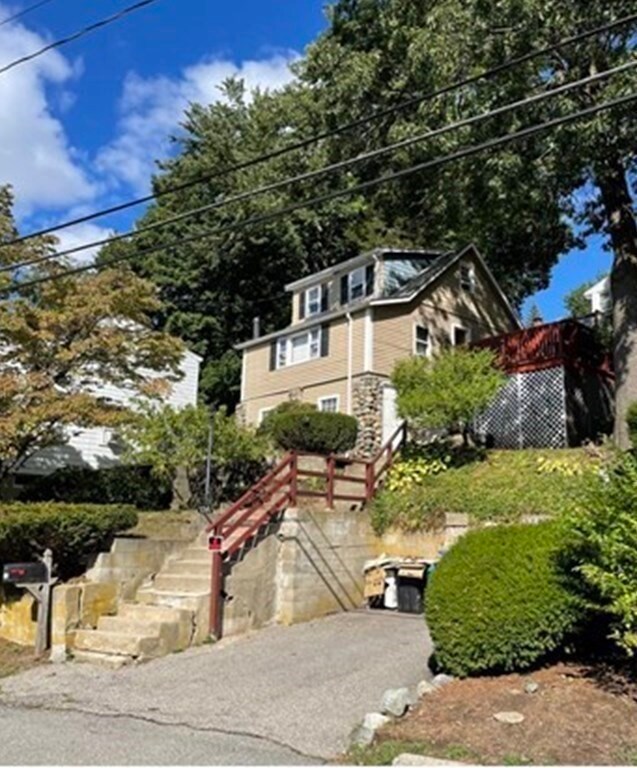
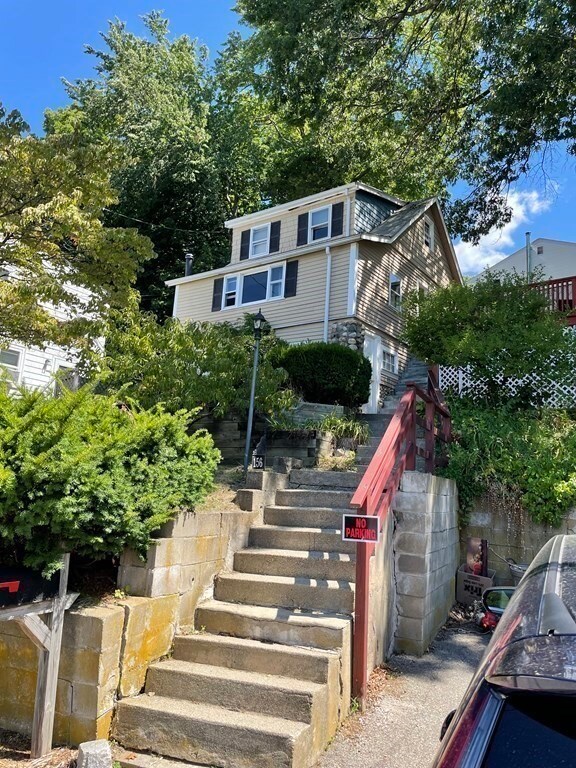
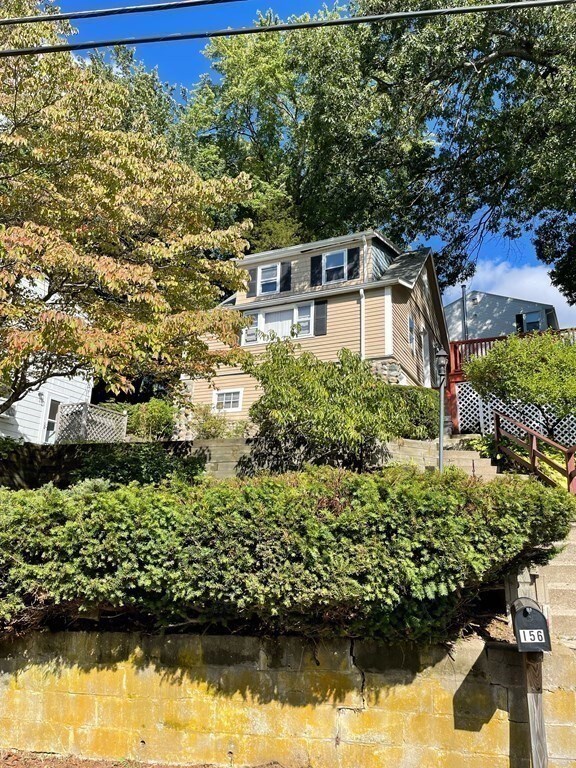
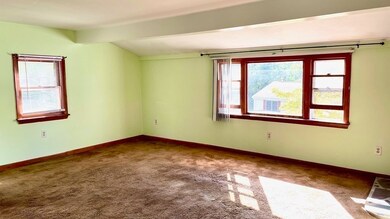
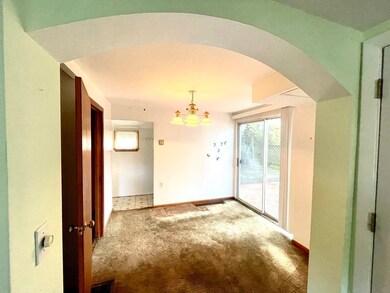
***ATTENTION CONTRACTORS AND REHABBERS*** Great opportunity to rebuild or rehab! Property is need of repairs or tear down and is priced accordingly. Located in desirable North Waltham, Lakeview Community. Good sized living room with picture window and wood burning fireplace, eat in kitchen, large window, dining room with slider to side deck, 2 bedrooms,1 full bath, and small yard with grape vines! This homes LOCATION is easily accessible to major routes 95/128, Rt.60 and Rt. 2. Close to Lazazzero playground/ spray park, Hardy Pond, (outdoor recreation...canoeing, fishing, ice skating), Pizzi Farm, (Deli,ice cream stand) local shops (CVS, TJ Max, Staples) Dunkins, Post Office and restaurants close by! Waltham offers so many great restaurants on Moody St.,Train (on Carter St.), Public Transportation not far from Bentley Univ. and across town to Brandeis Univ.
Last Agent to Sell the Property
Berkshire Hathaway HomeServices Commonwealth Real Estate Listed on: 09/08/2022
Last Buyer's Agent
Benjamin Ginsburg
Redfin Corp.
| Date | Buyer | Sale Price | Title Company |
|---|---|---|---|
| Leone Anthony | -- | -- |
| Date | Event | Price | List to Sale | Price per Sq Ft |
|---|---|---|---|---|
| 11/09/2022 11/09/22 | Sold | $361,000 | -9.7% | $315 / Sq Ft |
| 09/23/2022 09/23/22 | Pending | -- | -- | -- |
| 09/08/2022 09/08/22 | For Sale | $399,900 | -- | $349 / Sq Ft |
| Year | Tax Paid | Tax Assessment Tax Assessment Total Assessment is a certain percentage of the fair market value that is determined by local assessors to be the total taxable value of land and additions on the property. | Land | Improvement |
|---|---|---|---|---|
| 2025 | $4,689 | $477,500 | $323,600 | $153,900 |
| 2024 | $4,434 | $460,000 | $308,200 | $151,800 |
| 2023 | $4,435 | $429,700 | $281,400 | $148,300 |
| 2022 | $4,429 | $397,600 | $254,600 | $143,000 |
| 2021 | $4,262 | $376,500 | $254,600 | $121,900 |
| 2020 | $4,338 | $363,000 | $241,200 | $121,800 |
| 2019 | $4,420 | $349,100 | $227,300 | $121,800 |
| 2018 | $4,054 | $321,500 | $210,400 | $111,100 |
| 2017 | $3,794 | $302,100 | $191,000 | $111,100 |
| 2016 | $3,541 | $289,300 | $178,200 | $111,100 |
| 2015 | $3,658 | $278,600 | $167,500 | $111,100 |
Seller's Agent in 2022
Claire Leblanc
Berkshire Hathaway HomeServices Commonwealth Real Estate
(781) 424-5443
1 in this area
19 Total Sales
A
Seller Co-Listing Agent in 2022
Anita Hebert
Berkshire Hathaway HomeServices Commonwealth Real Estate
(617) 448-4301
2 in this area
16 Total Sales
B
Buyer's Agent in 2022
Benjamin Ginsburg
Redfin Corp.
Source: MLS Property Information Network (MLS PIN)
MLS Number: 73033770
APN: WALT-000022-000033-000028
Disclaimer: Certain information contained herein is derived from information provided by parties other than Homes.com. All information provided is deemed reliable, but is not guaranteed to be accurate and should be independently verified.
![]() The property listing data and information, or the Images, set forth herein were provided to MLS Property Information Network, Inc. from third party sources, including sellers, lessors and public records, and were compiled by MLS Property Information Network, Inc. The property listing data and information, and the Images, are for the personal, non-commercial use of consumers having a good faith interest in purchasing or leasing listed properties of the type displayed to them and may not be used for any purpose other than to identify prospective properties which such consumers may have a good faith interest in purchasing or leasing. MLS Property Information Network, Inc. and its subscribers disclaim any and all representations and warranties as to the accuracy of the property listing data and information, or as to the accuracy of any of the Images, set forth herein.
The property listing data and information, or the Images, set forth herein were provided to MLS Property Information Network, Inc. from third party sources, including sellers, lessors and public records, and were compiled by MLS Property Information Network, Inc. The property listing data and information, and the Images, are for the personal, non-commercial use of consumers having a good faith interest in purchasing or leasing listed properties of the type displayed to them and may not be used for any purpose other than to identify prospective properties which such consumers may have a good faith interest in purchasing or leasing. MLS Property Information Network, Inc. and its subscribers disclaim any and all representations and warranties as to the accuracy of the property listing data and information, or as to the accuracy of any of the Images, set forth herein.