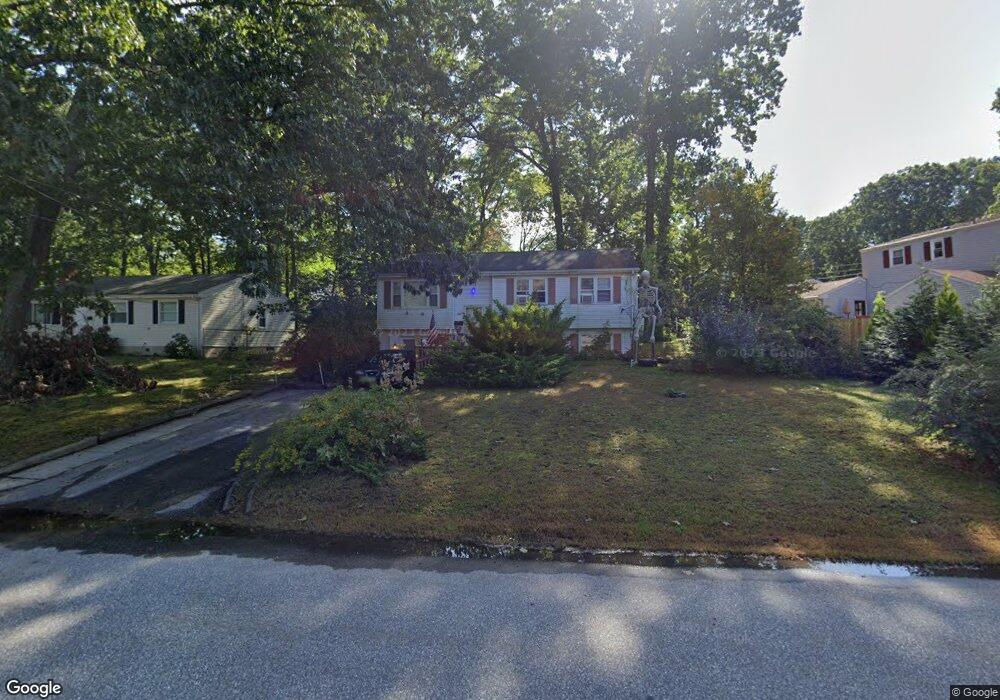
156 Roanoak Ave Willimantic, CT 06226
Estimated Value: $257,000 - $274,000
3
Beds
3
Baths
954
Sq Ft
$282/Sq Ft
Est. Value
About This Home
This home is located at 156 Roanoak Ave, Willimantic, CT 06226 and is currently estimated at $269,217, approximately $282 per square foot. 156 Roanoak Ave is a home located in Windham County with nearby schools including Windham Middle School, Windham High School, and Oak Grove Montessori School.
Ownership History
Date
Name
Owned For
Owner Type
Purchase Details
Closed on
Aug 25, 2004
Sold by
Geier Michele H
Bought by
Baker Carl A
Current Estimated Value
Home Financials for this Owner
Home Financials are based on the most recent Mortgage that was taken out on this home.
Original Mortgage
$155,000
Interest Rate
6.02%
Mortgage Type
Purchase Money Mortgage
Purchase Details
Closed on
Jan 28, 2002
Sold by
Doughty Diane
Bought by
Saydah Michelle
Create a Home Valuation Report for This Property
The Home Valuation Report is an in-depth analysis detailing your home's value as well as a comparison with similar homes in the area
Home Values in the Area
Average Home Value in this Area
Purchase History
| Date | Buyer | Sale Price | Title Company |
|---|---|---|---|
| Baker Carl A | $155,000 | -- | |
| Saydah Michelle | $119,900 | -- |
Source: Public Records
Mortgage History
| Date | Status | Borrower | Loan Amount |
|---|---|---|---|
| Open | Saydah Michelle | $155,300 | |
| Closed | Saydah Michelle | $159,475 | |
| Closed | Saydah Michelle | $155,000 | |
| Previous Owner | Saydah Michelle | $117,000 |
Source: Public Records
Tax History
| Year | Tax Paid | Tax Assessment Tax Assessment Total Assessment is a certain percentage of the fair market value that is determined by local assessors to be the total taxable value of land and additions on the property. | Land | Improvement |
|---|---|---|---|---|
| 2025 | $4,792 | $129,450 | $27,850 | $101,600 |
| 2024 | $4,797 | $129,450 | $27,850 | $101,600 |
| 2023 | $4,720 | $99,580 | $24,210 | $75,370 |
| 2022 | $4,650 | $99,580 | $24,210 | $75,370 |
| 2021 | $4,988 | $99,580 | $24,210 | $75,370 |
| 2020 | $4,977 | $99,580 | $24,210 | $75,370 |
| 2019 | $4,896 | $99,580 | $24,210 | $75,370 |
| 2017 | $4,227 | $88,780 | $21,680 | $67,100 |
| 2015 | $4,082 | $88,780 | $21,680 | $67,100 |
| 2014 | $3,856 | $88,780 | $21,680 | $67,100 |
Source: Public Records
Map
Nearby Homes
- 5 Kathleen Dr
- 60 Highland Rd
- 5 Charles St
- 33 Oak Dr
- 10 Liberty Dr
- 73 Spring St
- 41 Spring St
- 17 Pearl St
- 335 Pleasant St
- 129 Valley St
- 125 Mountain St
- 172 Old Willimantic Rd
- 54 Meadowbrook Ln
- 26 Maple Ave
- 48 Eastbrook Heights Unit C
- 40 Eastbrook Heights Unit C
- 63 Eastbrook Heights Unit E
- 615 Jackson St
- 0 Storrs Rd Unit 2 170571015
- 39 Pleasant View Ave
Your Personal Tour Guide
Ask me questions while you tour the home.