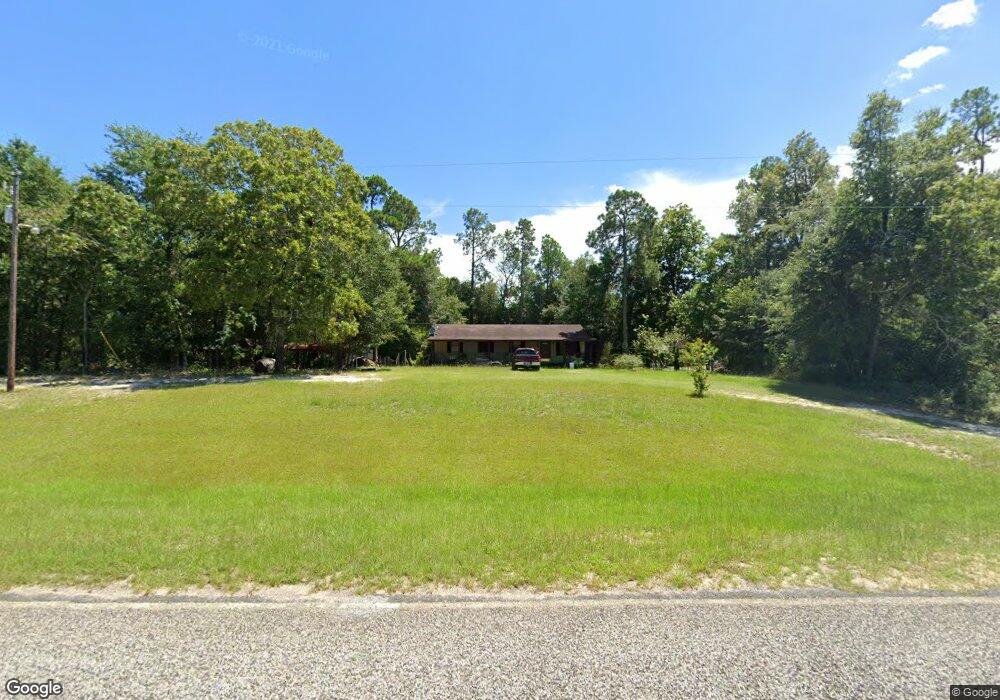
156 Shell Bluff Landing Rd Waynesboro, GA 30830
Estimated Value: $116,000 - $171,000
2
Beds
2
Baths
1,152
Sq Ft
$123/Sq Ft
Est. Value
About This Home
This home is located at 156 Shell Bluff Landing Rd, Waynesboro, GA 30830 and is currently estimated at $141,689, approximately $122 per square foot. 156 Shell Bluff Landing Rd is a home located in Burke County with nearby schools including Burke County High School.
Ownership History
Date
Name
Owned For
Owner Type
Purchase Details
Closed on
Oct 22, 2021
Sold by
Queensborough National Bank & Trust Co
Bought by
Waynesboro Farm Land 1 Llc
Current Estimated Value
Purchase Details
Closed on
Dec 1, 2020
Sold by
Hart Acquisitions Llc
Bought by
Queensborough National Bank And Tr
Purchase Details
Closed on
May 16, 2012
Sold by
Hatcher William D
Bought by
Hart Acquisitions Llc
Purchase Details
Closed on
Apr 21, 2011
Sold by
Federal National Mortgage Association
Bought by
Hatcher William G
Purchase Details
Closed on
Feb 1, 2011
Sold by
Wells Fargo Bank Na
Bought by
Federal National Mtg Associati
Purchase Details
Closed on
Dec 10, 1999
Sold by
Smith Daniel L
Bought by
Smith Pamela M
Purchase Details
Closed on
Sep 21, 1992
Sold by
Yantis Pamela M
Bought by
Smith Daniel L
Create a Home Valuation Report for This Property
The Home Valuation Report is an in-depth analysis detailing your home's value as well as a comparison with similar homes in the area
Home Values in the Area
Average Home Value in this Area
Purchase History
| Date | Buyer | Sale Price | Title Company |
|---|---|---|---|
| Waynesboro Farm Land 1 Llc | $10,500,000 | -- | |
| Queensborough National Bank And Tr | -- | -- | |
| Hart Acquisitions Llc | $52,500 | -- | |
| Hatcher William G | $15,000 | -- | |
| Hatcher William G | $15,000 | -- | |
| Federal National Mtg Associati | $69,759 | -- | |
| Wells Fargo Bank Na | $69,759 | -- | |
| Federal National Mtg Associati | $69,759 | -- | |
| Wells Fargo Bank Na | $69,759 | -- | |
| Smith Pamela M | -- | -- | |
| Smith Daniel L | $1,500 | -- |
Source: Public Records
Tax History Compared to Growth
Tax History
| Year | Tax Paid | Tax Assessment Tax Assessment Total Assessment is a certain percentage of the fair market value that is determined by local assessors to be the total taxable value of land and additions on the property. | Land | Improvement |
|---|---|---|---|---|
| 2024 | $765 | $39,227 | $3,096 | $36,131 |
| 2023 | $787 | $36,856 | $1,393 | $35,463 |
| 2022 | $673 | $31,517 | $1,393 | $30,124 |
| 2021 | $564 | $25,757 | $1,393 | $24,364 |
| 2020 | $565 | $25,757 | $1,393 | $24,364 |
| 2019 | $512 | $22,944 | $1,393 | $21,551 |
| 2018 | $512 | $22,944 | $1,393 | $21,551 |
| 2017 | $459 | $20,517 | $1,393 | $19,124 |
| 2016 | $462 | $20,517 | $1,393 | $19,124 |
| 2015 | $467 | $20,589 | $1,393 | $19,196 |
| 2014 | $471 | $20,590 | $1,393 | $19,196 |
| 2013 | -- | $20,589 | $1,393 | $19,196 |
Source: Public Records
Map
Nearby Homes
- 159 Rivers Run
- 205 Rivers Run
- 309 Rivers Run
- 323 Rivers Run
- 365 Rivers Run
- 383 Rivers Run
- 21 ACRES River Rd
- 0 River Rd Unit 544387
- Lot 11 Marie Vann Rd
- 0 Hancock Landing Rd Unit 23073266
- 0 Hancock Landing Rd Unit 543306
- 0 Highway 23 Unit 546224
- 664 Bennock Mill Rd
- 792 Done Roven Rd
- 0 Shell Bluff Country Estates
- 00 Highway 23
- 5256 Georgia 56
- 191 Ponderosa Rd
- 5220 Mike Padgett Hwy
- 5234 Old Mike Padgett Hwy
- 126 Sunrise Dr
- 104 Sunrise Ridge Rd
- 202 Shell Bluff Landing Rd
- 144 Shell Bluff Landing Rd
- 212 Shell Bluff Landing Rd
- 3715 River Rd
- 204 Sunrise Dr
- 0 Shell Bluff Landing Rd
- 242 Shell Bluff Landing Rd
- 242 Shell Bluff Landing Rd
- 575 Sunrise Dr
- 226 Sunrise Dr
- 3 Sunrise Dr
- 4 Sunrise Dr
- 566 Sunrise Dr
- 564 Sunrise Dr
- 4765 Ga Highway 80 E
- 554 Sunrise Dr
- 490 Sunrise Dr
- 452 Shell Bluff Landing Rd