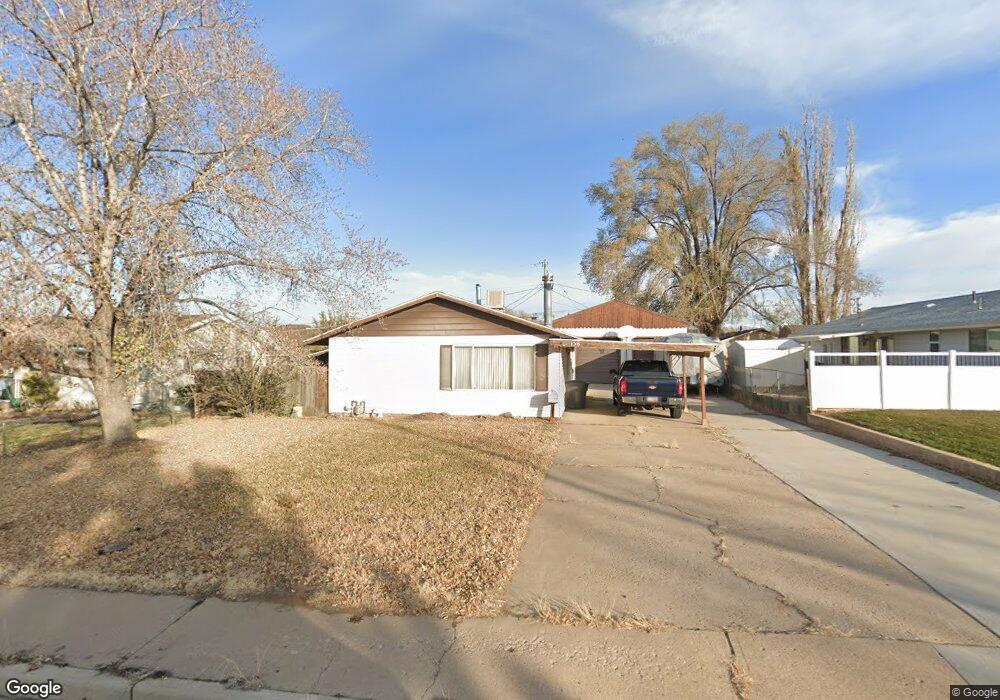
156 W 1250 N Clearfield, UT 84015
Estimated Value: $326,000 - $355,292
3
Beds
1
Bath
1,092
Sq Ft
$314/Sq Ft
Est. Value
About This Home
This home is located at 156 W 1250 N, Clearfield, UT 84015 and is currently estimated at $342,823, approximately $313 per square foot. 156 W 1250 N is a home located in Davis County with nearby schools including Doxey School, Sunset Junior High School, and Northridge High School.
Ownership History
Date
Name
Owned For
Owner Type
Purchase Details
Closed on
Jul 9, 2010
Sold by
Aston Greg J
Bought by
Aston Gregory J
Current Estimated Value
Home Financials for this Owner
Home Financials are based on the most recent Mortgage that was taken out on this home.
Original Mortgage
$85,130
Interest Rate
4.17%
Mortgage Type
New Conventional
Purchase Details
Closed on
May 12, 2000
Sold by
Banc One Financial Services Inc
Bought by
Aston Greg J
Home Financials for this Owner
Home Financials are based on the most recent Mortgage that was taken out on this home.
Original Mortgage
$95,540
Interest Rate
8.22%
Mortgage Type
FHA
Purchase Details
Closed on
Mar 7, 2000
Sold by
Overduyn Brandon M and Overduyn Rae Lynn
Bought by
Banc One Financial Services Inc
Purchase Details
Closed on
May 7, 1999
Sold by
Overduyn Brandon M and Overduyn Rae Lynn
Bought by
Overduyn David J and Overduyn Rebecca M
Create a Home Valuation Report for This Property
The Home Valuation Report is an in-depth analysis detailing your home's value as well as a comparison with similar homes in the area
Home Values in the Area
Average Home Value in this Area
Purchase History
| Date | Buyer | Sale Price | Title Company |
|---|---|---|---|
| Aston Gregory J | -- | Security Title Of Davis | |
| Aston Greg J | -- | Associated Title Company | |
| Banc One Financial Services Inc | $81,000 | Inwest Title Services Inc | |
| Overduyn David J | -- | -- |
Source: Public Records
Mortgage History
| Date | Status | Borrower | Loan Amount |
|---|---|---|---|
| Closed | Aston Gregory J | $85,130 | |
| Closed | Aston Greg J | $95,540 |
Source: Public Records
Tax History Compared to Growth
Tax History
| Year | Tax Paid | Tax Assessment Tax Assessment Total Assessment is a certain percentage of the fair market value that is determined by local assessors to be the total taxable value of land and additions on the property. | Land | Improvement |
|---|---|---|---|---|
| 2025 | $1,875 | $171,050 | $73,665 | $97,385 |
| 2024 | $1,742 | $158,950 | $70,417 | $88,533 |
| 2023 | $1,623 | $270,000 | $112,552 | $157,448 |
| 2022 | $1,729 | $155,651 | $64,433 | $91,218 |
| 2021 | $1,484 | $210,000 | $69,058 | $140,942 |
| 2020 | $1,301 | $181,000 | $58,200 | $122,800 |
| 2019 | $1,233 | $176,000 | $74,527 | $101,473 |
| 2018 | $1,102 | $154,000 | $59,558 | $94,442 |
| 2016 | $958 | $68,750 | $28,159 | $40,591 |
| 2015 | $901 | $61,270 | $28,159 | $33,111 |
| 2014 | $879 | $61,066 | $28,159 | $32,907 |
| 2013 | -- | $58,306 | $23,265 | $35,041 |
Source: Public Records
Map
Nearby Homes