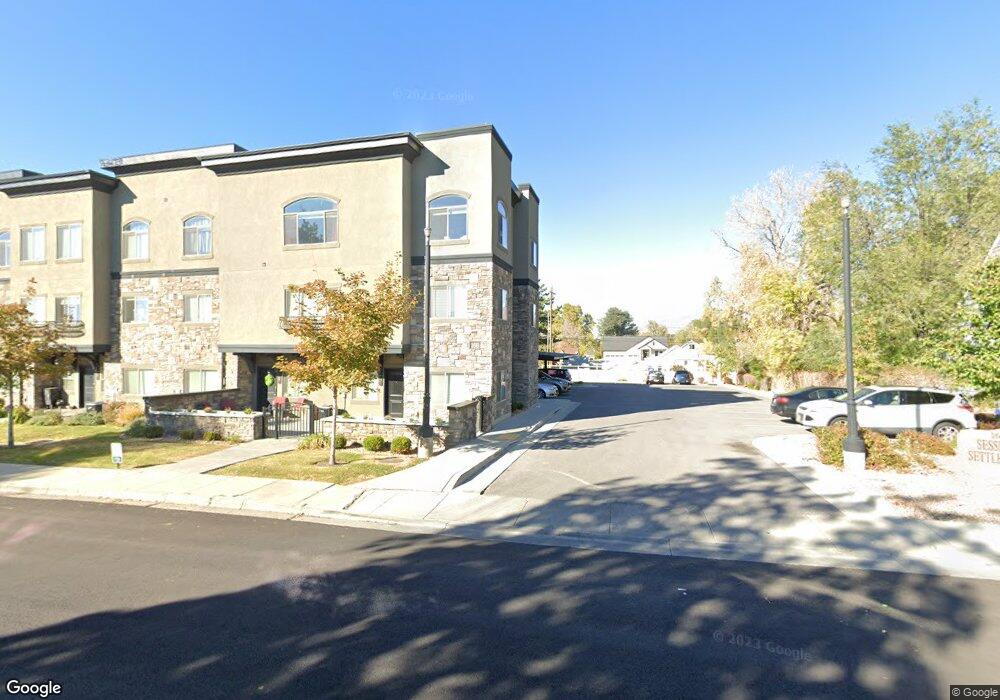
156 W 200 S Bountiful, UT 84010
Estimated Value: $410,593 - $546,000
3
Beds
3
Baths
1,292
Sq Ft
$365/Sq Ft
Est. Value
About This Home
This home is located at 156 W 200 S, Bountiful, UT 84010 and is currently estimated at $472,148, approximately $365 per square foot. 156 W 200 S is a home located in Davis County with nearby schools including Holbrook Elementary School, Millcreek Junior High School, and Bountiful High School.
Ownership History
Date
Name
Owned For
Owner Type
Purchase Details
Closed on
Dec 12, 1997
Sold by
Pollard Michelle
Bought by
Mccloskey Michelle W
Current Estimated Value
Home Financials for this Owner
Home Financials are based on the most recent Mortgage that was taken out on this home.
Original Mortgage
$86,500
Interest Rate
7.22%
Purchase Details
Closed on
Jan 1, 1997
Sold by
Pollard Michelle and Weidauer Michelle
Bought by
Pollard Michelle
Home Financials for this Owner
Home Financials are based on the most recent Mortgage that was taken out on this home.
Original Mortgage
$25,343
Interest Rate
6.96%
Purchase Details
Closed on
Jan 16, 1996
Sold by
Weidauer Dan and Weidauer Danny R
Bought by
Pollard Michelle and Weidauer Michelle
Create a Home Valuation Report for This Property
The Home Valuation Report is an in-depth analysis detailing your home's value as well as a comparison with similar homes in the area
Purchase History
| Date | Buyer | Sale Price | Title Company |
|---|---|---|---|
| Mccloskey Michelle W | -- | Blacks Title Inc | |
| Pollard Michelle | -- | Associated Title Company | |
| Pollard Michelle | -- | Blacks Title Inc |
Source: Public Records
Mortgage History
| Date | Status | Borrower | Loan Amount |
|---|---|---|---|
| Previous Owner | Mccloskey Michelle W | $86,500 | |
| Previous Owner | Pollard Michelle | $25,343 |
Source: Public Records
Tax History
| Year | Tax Paid | Tax Assessment Tax Assessment Total Assessment is a certain percentage of the fair market value that is determined by local assessors to be the total taxable value of land and additions on the property. | Land | Improvement |
|---|---|---|---|---|
| 2025 | $258 | $106,314 | $106,314 | $0 |
| 2024 | $850 | $101,821 | $101,821 | $0 |
| 2023 | $1,179 | $98,826 | $98,826 | $0 |
| 2022 | $1,182 | $179,685 | $179,685 | $0 |
| 2021 | $284 | $166,347 | $166,347 | $0 |
| 2020 | $1,089 | $141,105 | $141,105 | $0 |
| 2019 | $1,120 | $142,442 | $142,442 | $0 |
| 2018 | $1,111 | $139,480 | $139,480 | $0 |
| 2016 | $32 | $108,724 | $108,724 | $0 |
| 2015 | $1,627 | $112,530 | $59,798 | $52,732 |
| 2014 | $1,798 | $129,508 | $59,798 | $69,710 |
| 2013 | -- | $94,613 | $43,945 | $50,668 |
Source: Public Records
Map
Nearby Homes
- 32 W 400 S
- 34 W 400 S
- 75 N Peregrine Ln W Unit 8
- 650 S Main St Unit 9106
- 51 E 200 N Unit 3
- 55 E 200 N Unit 2
- 254 N Main St
- 256 N Main St
- 252 N Main St
- 41 E 200 N Unit 6
- 49 E 200 N Unit 4
- 320 N 200 W Unit 4
- 332 N 300 W
- 545 S 100 E
- 399 W 400 N Unit 47
- 360 W 800 S
- 401 W 400 N Unit 49
- 290 N 500 W Unit 305
- 376 W 800 S
- 499 N 200 W Unit 30
Your Personal Tour Guide
Ask me questions while you tour the home.