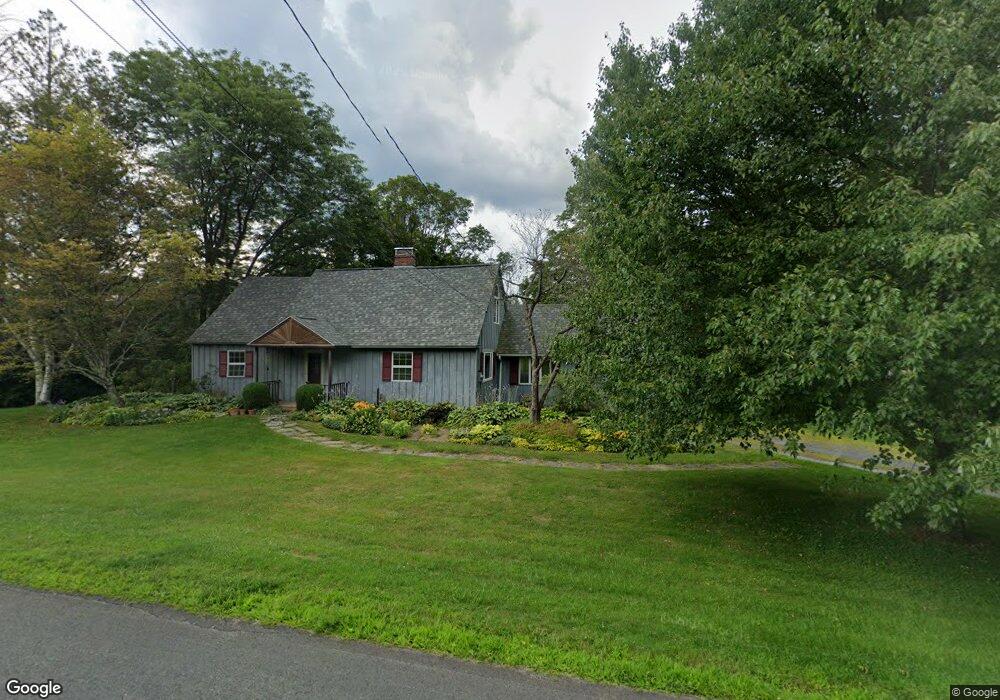
156 Yokun Rd Pittsfield, MA 01201
Estimated Value: $653,000 - $861,000
4
Beds
3
Baths
2,481
Sq Ft
$298/Sq Ft
Est. Value
About This Home
This home is located at 156 Yokun Rd, Pittsfield, MA 01201 and is currently estimated at $738,441, approximately $297 per square foot. 156 Yokun Rd is a home with nearby schools including Richmond Consolidated School.
Ownership History
Date
Name
Owned For
Owner Type
Purchase Details
Closed on
Jan 6, 2023
Sold by
Sinkoff James and Hildebrandt Sarah
Bought by
Hildebrandt Sarah
Current Estimated Value
Home Financials for this Owner
Home Financials are based on the most recent Mortgage that was taken out on this home.
Original Mortgage
$120,000
Outstanding Balance
$113,786
Interest Rate
4%
Mortgage Type
Adjustable Rate Mortgage/ARM
Estimated Equity
$624,655
Purchase Details
Closed on
Sep 14, 1999
Sold by
Morris Bobbie and Sinkoff James
Bought by
Sinkoff James and Sinkoff Sarah
Home Financials for this Owner
Home Financials are based on the most recent Mortgage that was taken out on this home.
Original Mortgage
$155,000
Interest Rate
7.65%
Mortgage Type
Purchase Money Mortgage
Purchase Details
Closed on
Jan 5, 1996
Sold by
Campoli Thomas L and Campoli Cheryl D
Bought by
Morris William R and Morris Bobbie
Create a Home Valuation Report for This Property
The Home Valuation Report is an in-depth analysis detailing your home's value as well as a comparison with similar homes in the area
Home Values in the Area
Average Home Value in this Area
Purchase History
| Date | Buyer | Sale Price | Title Company |
|---|---|---|---|
| Hildebrandt Sarah | -- | None Available | |
| Hildebrandt Sarah | -- | None Available | |
| Sinkoff James | $275,000 | -- | |
| Morris William R | $240,000 | -- | |
| Sinkoff James | $275,000 | -- | |
| Morris William R | $240,000 | -- |
Source: Public Records
Mortgage History
| Date | Status | Borrower | Loan Amount |
|---|---|---|---|
| Open | Hildebrandt Sarah | $120,000 | |
| Closed | Hildebrandt Sarah | $120,000 | |
| Previous Owner | Morris William R | $100,000 | |
| Previous Owner | Morris William R | $50,000 | |
| Previous Owner | Morris William R | $155,000 |
Source: Public Records
Tax History Compared to Growth
Tax History
| Year | Tax Paid | Tax Assessment Tax Assessment Total Assessment is a certain percentage of the fair market value that is determined by local assessors to be the total taxable value of land and additions on the property. | Land | Improvement |
|---|---|---|---|---|
| 2025 | $7,063 | $714,900 | $235,700 | $479,200 |
| 2024 | $6,855 | $704,500 | $225,800 | $478,700 |
| 2023 | $6,975 | $654,300 | $258,400 | $395,900 |
| 2022 | $6,887 | $540,600 | $258,400 | $282,200 |
| 2021 | $6,417 | $504,500 | $258,400 | $246,100 |
| 2020 | $6,134 | $495,500 | $258,200 | $237,300 |
| 2019 | $5,976 | $495,500 | $258,200 | $237,300 |
| 2018 | $5,822 | $495,500 | $258,200 | $237,300 |
| 2016 | $5,683 | $495,500 | $258,200 | $237,300 |
| 2015 | $5,441 | $495,500 | $258,200 | $237,300 |
Source: Public Records
Map
Nearby Homes
- 20 Pine Rd
- 399 State Rd
- 1136 Barker Rd Unit 11
- 1136 Barker Rd Unit 18
- 0 Dublin Rd
- 115 Cloverdale St
- 0 Swamp Rd
- Lot 0 Dublin Rd
- 802 State Rd
- 257 W Mountain Rd
- 1130 East Rd
- 1772 Swamp Rd
- 627 Lenox Rd
- 319 Under Mountain Rd
- 712 Barker Rd
- 551 Tamarack Rd
- 308 Lenox Rd
- 103 Alpine Trail
- 249 Pittsfield Rd
- 0 Jones Ave