1560 Brandi Way Pullman, WA 99163
3
Beds
--
Bath
1,238
Sq Ft
--
Built
About This Home
Located less than one mile from Washington State University, we offer on-site amenities like a 24-hour fitness center, a resort-style pool, a tavern-style game room, and a computer lab with free printing.
You can start your day at our clubhouse coffee bistro, walk or ride to campus, and come home for a meal with friends at our outdoor grill or host a group study session in our clubhouse. This is your home for work and play, for social community and student success. This is regular resident events, pet-friendly living, modern apartments, and an ideal address minutes from the WSU campus.
Create a Home Valuation Report for This Property
The Home Valuation Report is an in-depth analysis detailing your home's value as well as a comparison with similar homes in the area
Property History
| Date | Event | Price | List to Sale | Price per Sq Ft |
|---|---|---|---|---|
| 10/04/2025 10/04/25 | Off Market | $729 | -- | -- |
| 09/25/2024 09/25/24 | Price Changed | $729 | -2.8% | $1 / Sq Ft |
| 02/16/2024 02/16/24 | Price Changed | $750 | +2.0% | $1 / Sq Ft |
| 10/17/2023 10/17/23 | Price Changed | $735 | +4.3% | $1 / Sq Ft |
| 09/20/2023 09/20/23 | Price Changed | $705 | -7.8% | $1 / Sq Ft |
| 08/09/2023 08/09/23 | Price Changed | $765 | +5.5% | $1 / Sq Ft |
| 08/08/2023 08/08/23 | For Rent | $725 | 0.0% | -- |
| 07/13/2023 07/13/23 | For Rent | $725 | 0.0% | -- |
| 06/17/2023 06/17/23 | For Rent | $725 | 0.0% | -- |
| 03/14/2023 03/14/23 | Price Changed | $725 | +2.8% | $1 / Sq Ft |
| 01/06/2023 01/06/23 | Price Changed | $705 | -4.1% | $1 / Sq Ft |
| 08/29/2022 08/29/22 | Price Changed | $735 | +13.1% | $1 / Sq Ft |
| 08/23/2022 08/23/22 | For Rent | $650 | -- | -- |
Tax History
| Year | Tax Paid | Tax Assessment Tax Assessment Total Assessment is a certain percentage of the fair market value that is determined by local assessors to be the total taxable value of land and additions on the property. | Land | Improvement |
|---|---|---|---|---|
| 2026 | $520,374 | $44,744,853 | $2,325,145 | $42,419,708 |
| 2025 | $548,960 | $44,744,853 | $2,325,145 | $42,419,708 |
| 2024 | $575,412 | $41,128,383 | $1,605,000 | $39,523,383 |
| 2023 | $610,159 | $41,128,383 | $1,605,000 | $39,523,383 |
| 2022 | $609,838 | $41,128,383 | $1,070,000 | $40,058,383 |
| 2021 | $622,631 | $41,128,383 | $1,070,000 | $40,058,383 |
| 2020 | $612,172 | $41,128,383 | $1,070,000 | $40,058,383 |
| 2019 | $392,272 | $27,059,193 | $1,070,000 | $25,989,193 |
| 2018 | $408,936 | $27,059,193 | $1,070,000 | $25,989,193 |
| 2017 | $389,910 | $26,840,113 | $1,070,000 | $25,770,113 |
| 2016 | $414,943 | $26,840,113 | $1,070,000 | $25,770,113 |
| 2015 | $418,942 | $26,840,113 | $1,070,000 | $25,770,113 |
| 2014 | -- | $120,604 | $120,604 | $0 |
Source: Public Records
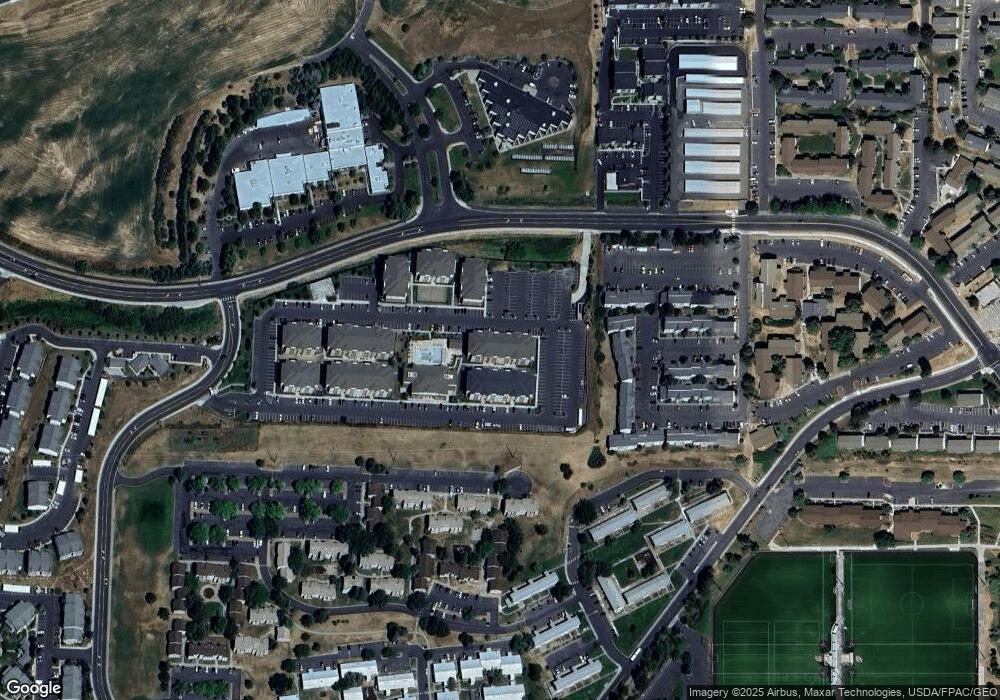
Map
Nearby Homes
- 348 NW Harrison St
- 1325 SW Panorama Dr
- 312 NW Harrison St
- 321 NW Cleveland St
- 308 NW Webb St
- 920 NW Charlotte St
- 605 NW Fisk St
- 515 NW Irving St
- 513-515 NE Kamiaken St
- 1220 NW State St Unit 28
- 805 NW Clifford St
- 1054 SE Bypass Dr
- 2090 NW Overlook Dr
- 1040 NW Clifford St
- 129 NW True St
- 645,645 1/2 NE Maple St
- 675 NE Maple St
- 535 NW Darrow St
- 1210 NW Clifford St
- 435 NE Howard St
- 333 NW Harrison St
- 349 NW Harrison St
- 329 NW Harrison St
- 340 NW Cleveland St
- 344 NW Cleveland St
- 336 NW Cleveland St
- 745 NW Bryant St
- 325 NW Harrison St
- 330 NW Harrison St
- 330 NW Harrison St
- 332 NW Cleveland St
- 740 NW Bryant St
- 328 NW Cleveland St
- 340 NW Harrison St
- 324 NW Cleveland St
- 344 NW Harrison St
- 321 NW Harrison St
- 316 NW Harrison St
- 730 NW Bryant St
- 320 NW Harrison St
Your Personal Tour Guide
Ask me questions while you tour the home.