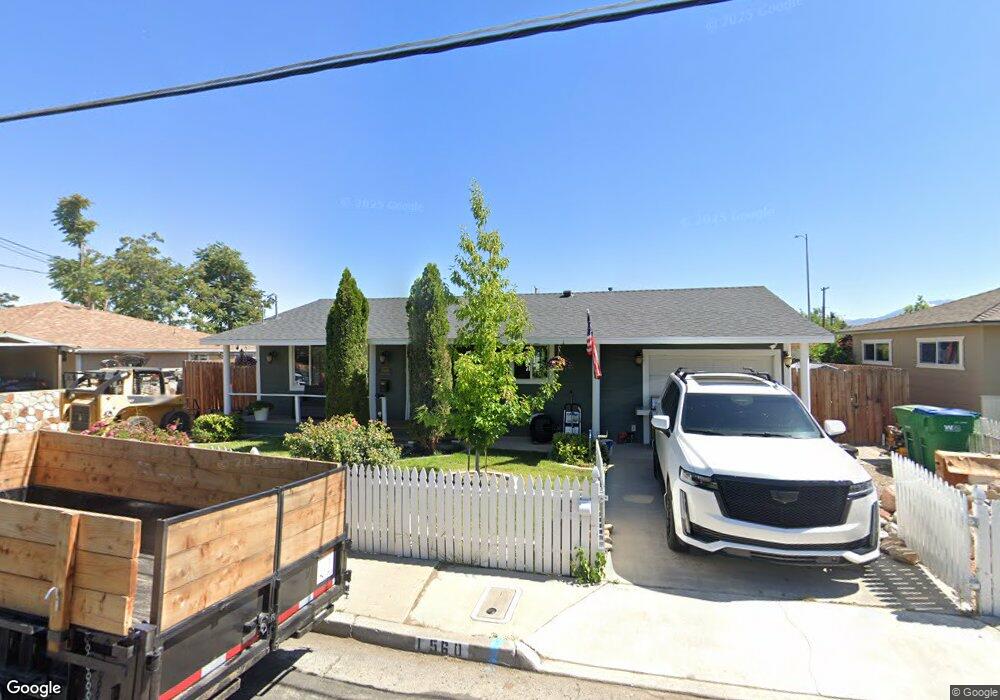
1560 Oliver St Reno, NV 89512
Northeast Reno NeighborhoodEstimated Value: $402,000 - $432,632
2
Beds
1
Bath
840
Sq Ft
$495/Sq Ft
Est. Value
About This Home
This home is located at 1560 Oliver St, Reno, NV 89512 and is currently estimated at $415,658, approximately $494 per square foot. 1560 Oliver St is a home located in Washoe County with nearby schools including Rita Cannan Elementary School, Fred W. Traner Middle School, and Procter R. Hug High School.
Ownership History
Date
Name
Owned For
Owner Type
Purchase Details
Closed on
Dec 5, 2021
Sold by
Hunter Jayson and Hunter Kathryn
Bought by
Martinez Oscar and Garcia Alexis
Current Estimated Value
Home Financials for this Owner
Home Financials are based on the most recent Mortgage that was taken out on this home.
Original Mortgage
$400,610
Outstanding Balance
$365,573
Interest Rate
3.14%
Mortgage Type
FHA
Estimated Equity
$50,085
Purchase Details
Closed on
Nov 30, 2017
Sold by
Hunter Jayson
Bought by
Hunter Jayson and Hunter Kathryn
Purchase Details
Closed on
Jul 20, 2007
Sold by
Larson Brenda K and Larson Christopher D
Bought by
Hunter Jayson
Home Financials for this Owner
Home Financials are based on the most recent Mortgage that was taken out on this home.
Original Mortgage
$146,160
Interest Rate
6.51%
Mortgage Type
FHA
Purchase Details
Closed on
Jul 24, 2005
Sold by
Wood David
Bought by
Larson Christopher D and Larson Brenda K
Home Financials for this Owner
Home Financials are based on the most recent Mortgage that was taken out on this home.
Original Mortgage
$136,000
Interest Rate
6.67%
Mortgage Type
Unknown
Purchase Details
Closed on
May 12, 2005
Sold by
Morse Richard Bruce
Bought by
Wood David
Create a Home Valuation Report for This Property
The Home Valuation Report is an in-depth analysis detailing your home's value as well as a comparison with similar homes in the area
Home Values in the Area
Average Home Value in this Area
Purchase History
| Date | Buyer | Sale Price | Title Company |
|---|---|---|---|
| Martinez Oscar | $414,000 | First Centennial Reno | |
| Hunter Jayson | -- | Acme Title And Escrow | |
| Hunter Jayson | $157,000 | First Centennial Title Co | |
| Larson Christopher D | $170,000 | First Centennial Title Co | |
| Wood David | -- | First Centennial Title Co | |
| Wood David | $94,001 | -- |
Source: Public Records
Mortgage History
| Date | Status | Borrower | Loan Amount |
|---|---|---|---|
| Open | Martinez Oscar | $400,610 | |
| Previous Owner | Hunter Jayson | $146,160 | |
| Previous Owner | Larson Christopher D | $136,000 |
Source: Public Records
Tax History
| Year | Tax Paid | Tax Assessment Tax Assessment Total Assessment is a certain percentage of the fair market value that is determined by local assessors to be the total taxable value of land and additions on the property. | Land | Improvement |
|---|---|---|---|---|
| 2026 | $1,401 | $62,468 | $26,418 | $36,050 |
| 2024 | $1,736 | $60,458 | $22,712 | $37,747 |
| 2023 | $1,611 | $60,944 | $24,917 | $36,028 |
| 2022 | $1,489 | $49,950 | $19,719 | $30,231 |
| 2021 | $1,380 | $43,906 | $13,451 | $30,455 |
| 2020 | $1,296 | $43,485 | $12,726 | $30,759 |
| 2019 | $1,056 | $38,326 | $12,695 | $25,631 |
| 2018 | $590 | $21,943 | $8,678 | $13,265 |
| 2017 | $372 | $14,963 | $7,515 | $7,448 |
| 2016 | $362 | $14,184 | $6,717 | $7,467 |
| 2015 | $360 | $11,943 | $4,622 | $7,321 |
| 2014 | $349 | $10,690 | $3,791 | $6,899 |
| 2013 | -- | $9,192 | $2,489 | $6,703 |
Source: Public Records
Map
Nearby Homes
- 2090 Fife Dr
- 74 Lilac Ln
- 1955 Wilder St
- 1939 Wilder St
- 2301 Oddie Blvd
- 180 Poppy Ln
- 35 Tulip Ct
- 2085 Highview Ct Unit 1
- 135 Carnation Ln
- 113 Lilac Ln
- 3505 Willow Hills Cir
- 2101 Highview Ct Unit 9
- 2355 Tripp Dr Unit 7
- 2385 Tripp Dr Unit 3
- 2385 Tripp Dr Unit 1
- 920 Montello St
- 1414 E 9th St Unit 4
- 2555 Clear Acre Ln Unit 78
- 2555 Clear Acre Ln Unit 16-1
- 670 Denslowe Dr
- 1560 Oliver Ave
- 1570 Oliver St
- 1550 Oliver St
- 1540 Oliver St
- 1580 Oliver St
- 1565 Oliver Ave
- 1575 Oliver St
- 1555 Oliver St
- 1565 Oliver St
- 1530 Oliver Ave
- 1530 Oliver St
- 1590 Oliver St
- 1590 Oliver Ave
- 1535 Oliver St
- 1735 Trainer Way
- 1725 Trainer Way
- 1805 Helena Ave
- 1765 Trainer Way
- 1520 Oliver St
- 1685 Trainer Way
Your Personal Tour Guide
Ask me questions while you tour the home.