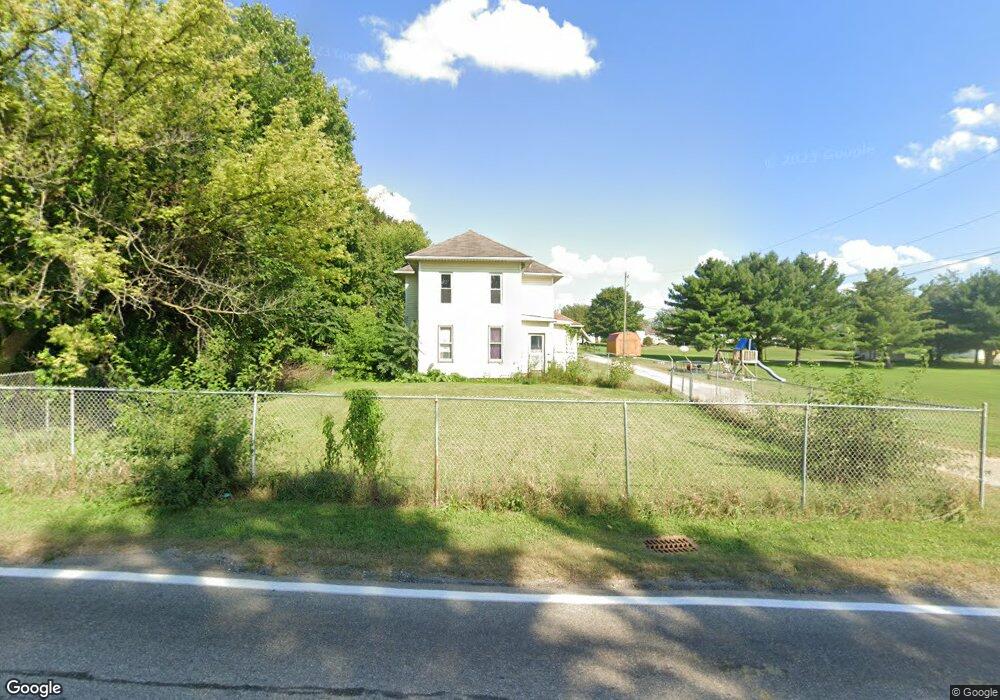
15600 Danville Jelloway Rd Danville, OH 43014
Estimated Value: $73,000 - $250,000
4
Beds
2
Baths
1,790
Sq Ft
$91/Sq Ft
Est. Value
About This Home
This home is located at 15600 Danville Jelloway Rd, Danville, OH 43014 and is currently estimated at $162,146, approximately $90 per square foot. 15600 Danville Jelloway Rd is a home located in Knox County with nearby schools including Danville Elementary School, Danville Middle School, and Danville High School.
Ownership History
Date
Name
Owned For
Owner Type
Purchase Details
Closed on
Aug 1, 2025
Sold by
Simon-Billman Lynn
Bought by
Wine Zachary and Wine Arian
Current Estimated Value
Home Financials for this Owner
Home Financials are based on the most recent Mortgage that was taken out on this home.
Original Mortgage
$72,000
Outstanding Balance
$71,939
Interest Rate
6.81%
Mortgage Type
Seller Take Back
Estimated Equity
$90,207
Purchase Details
Closed on
Apr 28, 2017
Sold by
Banbury Barbara H
Bought by
Billman James
Purchase Details
Closed on
Nov 19, 1998
Sold by
Banbury Mark and Banbury Barbara H
Bought by
Banbury Mark and Banbury Barbara H
Purchase Details
Closed on
Jun 4, 1998
Sold by
Loney James R
Bought by
Banbury Mark and Banbury Barbara H
Purchase Details
Closed on
Dec 21, 1990
Sold by
Breckler Louis Gregory
Bought by
Loney James R
Create a Home Valuation Report for This Property
The Home Valuation Report is an in-depth analysis detailing your home's value as well as a comparison with similar homes in the area
Home Values in the Area
Average Home Value in this Area
Purchase History
| Date | Buyer | Sale Price | Title Company |
|---|---|---|---|
| Wine Zachary | $72,000 | None Listed On Document | |
| Wine Zachary | $72,000 | None Listed On Document | |
| Simon-Billman Lynn | -- | None Listed On Document | |
| Billman James | $48,000 | None Available | |
| Banbury Mark | -- | -- | |
| Banbury Mark | $65,000 | -- | |
| Loney James R | $28,000 | -- |
Source: Public Records
Mortgage History
| Date | Status | Borrower | Loan Amount |
|---|---|---|---|
| Open | Wine Zachary | $72,000 | |
| Closed | Wine Zachary | $72,000 |
Source: Public Records
Tax History Compared to Growth
Tax History
| Year | Tax Paid | Tax Assessment Tax Assessment Total Assessment is a certain percentage of the fair market value that is determined by local assessors to be the total taxable value of land and additions on the property. | Land | Improvement |
|---|---|---|---|---|
| 2024 | $914 | $23,510 | $4,770 | $18,740 |
| 2023 | $871 | $23,510 | $4,770 | $18,740 |
| 2022 | $890 | $18,670 | $3,790 | $14,880 |
| 2021 | $809 | $18,670 | $3,790 | $14,880 |
| 2020 | $767 | $18,670 | $3,790 | $14,880 |
| 2019 | $1,064 | $24,580 | $3,440 | $21,140 |
| 2018 | $1,070 | $24,580 | $3,440 | $21,140 |
| 2017 | $1,100 | $24,580 | $3,440 | $21,140 |
| 2016 | $1,066 | $22,770 | $3,190 | $19,580 |
| 2015 | $993 | $22,770 | $3,190 | $19,580 |
| 2014 | $1,021 | $22,770 | $3,190 | $19,580 |
| 2013 | $1,121 | $23,880 | $2,990 | $20,890 |
Source: Public Records
Map
Nearby Homes
- 228 E Walnut St
- 204 S Richards St
- 106 W Rambo St
- 417 S Market St
- 0 Howard-Danville Rd
- 13904 Carey Ln
- 0 Hoover Rd
- 15757 Hunter Rd
- 29575 Hoover Rd
- 13356 Mowery Rd
- 0 King Rd Unit 20250360
- 0 King Rd Unit 225019584
- 143 Grand Ridge Rd
- 26301 Cavallo Rd
- 26083 Coshocton Rd
- 733 Grand View Dr
- 0 Grand Valley Dr Unit 5161854
- 701 Grand View Dr
- 0 Westmoreland Dr Unit 225036591
- 0 Westmoreland Dr Unit 225024813
- 15598 Danville-Jelloway Rd
- 15630 Danville Jelloway Rd
- 15596 Danville Jelloway Rd
- 15654 Danville Jelloway Rd
- 108 S Market St
- 108 N Market St
- 15595 Danville Jelloway Rd
- 2105 Market St
- 105 Plum St
- 7 Plum St
- 3 Plum St
- 5 Plum St
- 201 Plum St
- 101 Plum St
- 11 S Market St
- 107 Plum St
- 8 Cedar St
- 8 Plum St
- 6 Plum St
- 10 N Market St