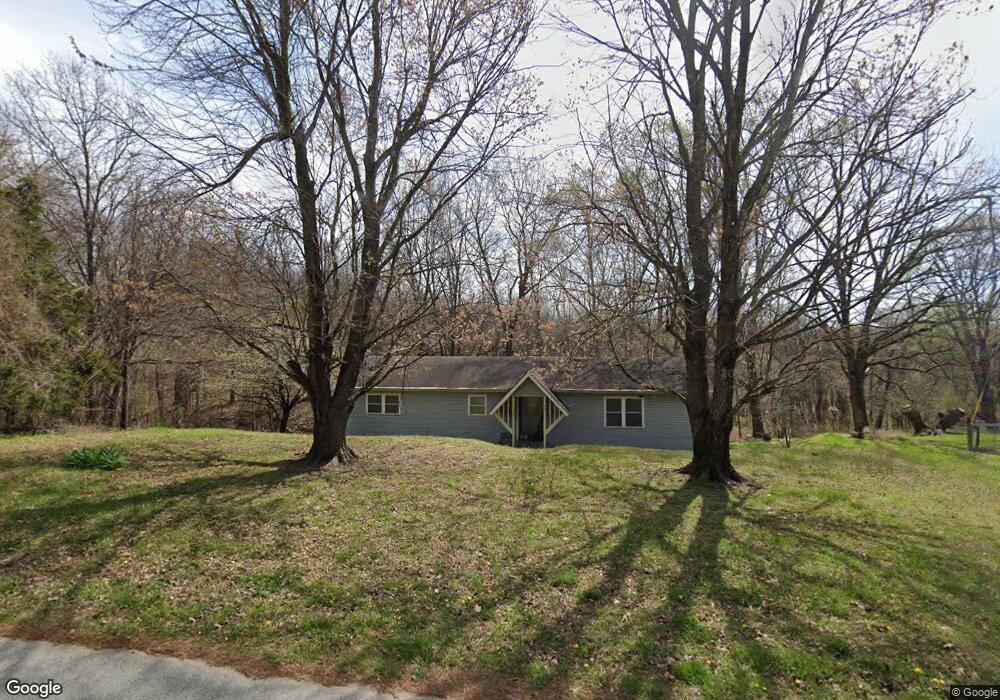
15600 N Wimpy Jones Rd Garfield, AR 72732
Estimated Value: $258,000 - $332,000
3
Beds
1
Bath
1,232
Sq Ft
$232/Sq Ft
Est. Value
About This Home
This home is located at 15600 N Wimpy Jones Rd, Garfield, AR 72732 and is currently estimated at $286,045, approximately $232 per square foot. 15600 N Wimpy Jones Rd is a home located in Benton County with nearby schools including Garfield Elementary School, Lingle Middle School, and Rogers Heritage High School.
Ownership History
Date
Name
Owned For
Owner Type
Purchase Details
Closed on
Aug 11, 2011
Sold by
Morrison Zannie Lee and Morrison Susan Marie
Bought by
Morrison Mark Christopher
Current Estimated Value
Home Financials for this Owner
Home Financials are based on the most recent Mortgage that was taken out on this home.
Original Mortgage
$73,098
Outstanding Balance
$50,447
Interest Rate
4.5%
Mortgage Type
FHA
Estimated Equity
$235,598
Purchase Details
Closed on
Aug 10, 2011
Sold by
Morrison Mark Christopher and Morrison Jackie
Bought by
Houk Durward B
Home Financials for this Owner
Home Financials are based on the most recent Mortgage that was taken out on this home.
Original Mortgage
$73,098
Outstanding Balance
$50,447
Interest Rate
4.5%
Mortgage Type
FHA
Estimated Equity
$235,598
Purchase Details
Closed on
Aug 3, 1999
Bought by
Morrison 5Ac
Create a Home Valuation Report for This Property
The Home Valuation Report is an in-depth analysis detailing your home's value as well as a comparison with similar homes in the area
Home Values in the Area
Average Home Value in this Area
Purchase History
| Date | Buyer | Sale Price | Title Company |
|---|---|---|---|
| Morrison Mark Christopher | -- | None Available | |
| Houk Durward B | $75,000 | None Available | |
| Morrison 5Ac | -- | -- |
Source: Public Records
Mortgage History
| Date | Status | Borrower | Loan Amount |
|---|---|---|---|
| Open | Houk Durward B | $73,098 |
Source: Public Records
Tax History Compared to Growth
Tax History
| Year | Tax Paid | Tax Assessment Tax Assessment Total Assessment is a certain percentage of the fair market value that is determined by local assessors to be the total taxable value of land and additions on the property. | Land | Improvement |
|---|---|---|---|---|
| 2025 | $856 | $43,648 | $18,000 | $25,648 |
| 2024 | $859 | $43,648 | $18,000 | $25,648 |
| 2023 | $898 | $27,990 | $13,000 | $14,990 |
| 2022 | $748 | $27,990 | $13,000 | $14,990 |
| 2021 | $706 | $27,990 | $13,000 | $14,990 |
| 2020 | $597 | $14,700 | $3,800 | $10,900 |
| 2019 | $597 | $14,700 | $3,800 | $10,900 |
| 2018 | $578 | $14,700 | $3,800 | $10,900 |
| 2017 | $571 | $14,700 | $3,800 | $10,900 |
| 2016 | $571 | $14,700 | $3,800 | $10,900 |
| 2015 | $876 | $16,500 | $7,200 | $9,300 |
| 2014 | $666 | $16,500 | $7,200 | $9,300 |
Source: Public Records
Map
Nearby Homes
- 0 N Wimpy Jones Rd Unit 1316500
- 5.32 Acres Deer Meadow Dr
- 22606 Dam Site Loop
- 15829 N Wimpy Jones Rd
- 0 U S Highway 62
- 22408 U S Highway 62
- 18943 Highway 62
- 14848 Wild Honey Ln
- 18582 N Highway 127
- 22AC Gann Ridge Rd
- 18898 Sugar Creek Rd
- 17619 Dennis Mitchell Rd
- 15624 Roberts Loop
- 15936 Skyline Dr
- 16856 Mahurin Loop
- 16150 Skyline Dr
- 16280 Boll Weevil Ln
- 18196 Beaver Hollow Rd
- 17159 Mill Hill Rd
- 18440 Beaver Hollow Rd
- 15578 N Wimpy Jones Rd
- 15577 N Wimpy Jones Rd
- 18175 Rocky Top Ln
- 18150 Rocky Top Ln
- 15660 N Wimpy Jones Rd
- 15484 N Wimpy Jones Rd
- 15429 N Wimpy Jones Rd
- Tract A Wimpy Jones Rd
- 0 N Wimpy Jones Rd Unit 617503
- 0 N Wimpy Jones Rd Unit 711846
- 0 N Wimpy Jones Rd Unit 1023857
- 0 N Wimpy Jones Rd Unit 1094939
- 18636 Deer Meadow Dr
- 15413 N Wimpy Jones Rd
- 18238 Deer Meadow Dr
- 18234 Deer Meadow Dr
- Lot 14 Deer Meadow Dr
- Tract 9 Deer Meadow Dr
- 18654 Deer Meadow Dr
- 15417 Limekiln Rd