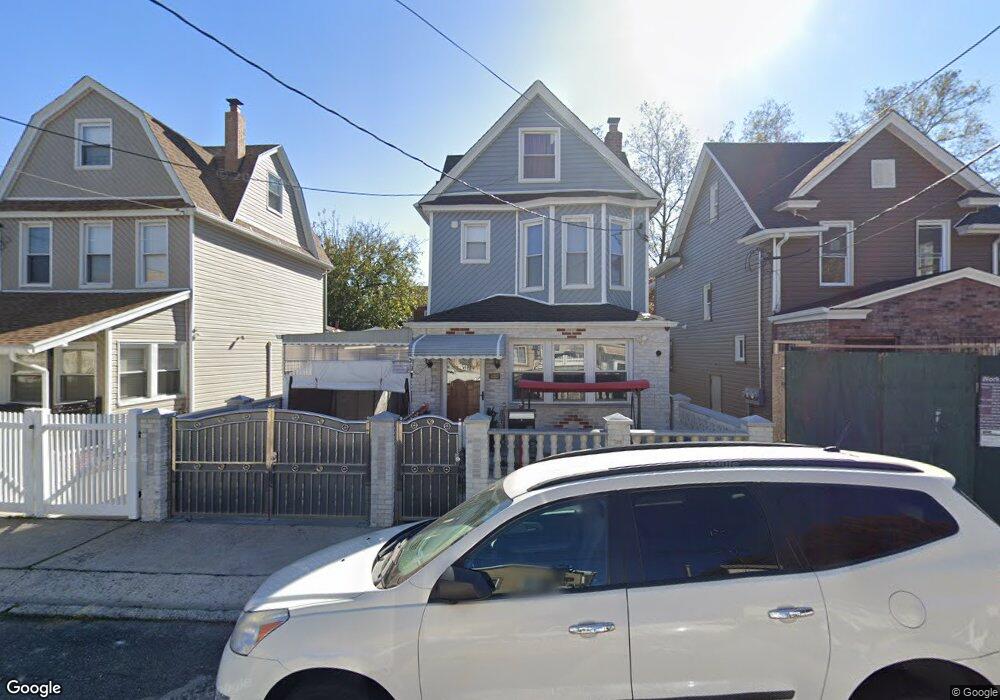
15606 113th Ave Jamaica, NY 11433
Jamaica NeighborhoodEstimated Value: $647,241 - $995,000
--
Bed
--
Bath
1,134
Sq Ft
$743/Sq Ft
Est. Value
About This Home
This home is located at 15606 113th Ave, Jamaica, NY 11433 and is currently estimated at $842,810, approximately $743 per square foot. 15606 113th Ave is a home located in Queens County with nearby schools including P.S. 48 William Wordsworth, Junior High School 8 Richard S Grossley, and Allen Christian School.
Ownership History
Date
Name
Owned For
Owner Type
Purchase Details
Closed on
Oct 20, 2017
Sold by
Mangar Mahendra and Reddi Tommy
Bought by
Somwar Devima and Somwar Shamer
Current Estimated Value
Purchase Details
Closed on
Dec 19, 2011
Sold by
Rdg Queens Llc
Bought by
Mangar Mahendra and Reddi Tommy
Home Financials for this Owner
Home Financials are based on the most recent Mortgage that was taken out on this home.
Original Mortgage
$316,761
Interest Rate
3.94%
Mortgage Type
New Conventional
Purchase Details
Closed on
Mar 18, 2011
Sold by
Morris James
Bought by
Rdg Queens Llc
Purchase Details
Closed on
Jan 27, 1998
Sold by
Progress Group Inc
Bought by
Morris James
Home Financials for this Owner
Home Financials are based on the most recent Mortgage that was taken out on this home.
Original Mortgage
$152,850
Interest Rate
6.9%
Mortgage Type
FHA
Purchase Details
Closed on
Oct 27, 1997
Sold by
Dufficy Esq Ann B
Bought by
Progress Group Inc
Create a Home Valuation Report for This Property
The Home Valuation Report is an in-depth analysis detailing your home's value as well as a comparison with similar homes in the area
Home Values in the Area
Average Home Value in this Area
Purchase History
| Date | Buyer | Sale Price | Title Company |
|---|---|---|---|
| Somwar Devima | -- | -- | |
| Mangar Mahendra | $325,000 | -- | |
| Rdg Queens Llc | $170,000 | -- | |
| Morris James | $154,000 | -- | |
| Progress Group Inc | $80,000 | -- |
Source: Public Records
Mortgage History
| Date | Status | Borrower | Loan Amount |
|---|---|---|---|
| Previous Owner | Mangar Mahendra | $316,761 | |
| Previous Owner | Morris James | $152,850 |
Source: Public Records
Tax History Compared to Growth
Tax History
| Year | Tax Paid | Tax Assessment Tax Assessment Total Assessment is a certain percentage of the fair market value that is determined by local assessors to be the total taxable value of land and additions on the property. | Land | Improvement |
|---|---|---|---|---|
| 2025 | $3,717 | $21,100 | $4,867 | $16,233 |
| 2024 | $3,729 | $19,906 | $5,013 | $14,893 |
| 2023 | $3,758 | $19,906 | $5,064 | $14,842 |
| 2022 | $3,528 | $42,840 | $10,380 | $32,460 |
| 2021 | $3,626 | $37,440 | $10,380 | $27,060 |
| 2020 | $3,426 | $32,220 | $10,380 | $21,840 |
| 2019 | $3,177 | $30,180 | $10,380 | $19,800 |
| 2018 | $3,084 | $16,588 | $6,522 | $10,066 |
| 2017 | $2,946 | $15,924 | $6,769 | $9,155 |
| 2016 | $2,795 | $15,924 | $6,769 | $9,155 |
| 2015 | $1,592 | $14,653 | $7,104 | $7,549 |
| 2014 | $1,592 | $13,824 | $7,716 | $6,108 |
Source: Public Records
Map
Nearby Homes
- 114-18 157th St
- 11166 158th St
- 111-58 158th St
- 11137 156th St
- 11416 James Ct
- 15027 Linden Blvd
- 15036 114th Rd
- 150-22 114th Rd
- 150-16 114th Rd
- 11281 Bedell St
- 111-41 Sutphin Blvd
- 15718 115th Rd Unit 2 Family
- 111-10 160th St
- 110-36 156th St
- 15539 115th Dr
- 153-17 111th Ave
- 115-36 157th St
- 155-11 115th Dr
- 114-27 Bedell St
- 11512 159th St
- 15604 113th Ave
- 15610 113th Ave
- 156-10 113th Ave
- 15616 113th Ave
- 15530 113th Ave
- 11306 157th St
- 15528 113th Ave
- 11302 157th St
- 15533 Linden Blvd
- 15529 Linden Blvd
- 15535 Linden Blvd
- 15525 Linden Blvd
- 15525 Linden Blvd
- 15524 113th Ave
- 155-24 113th Ave Unit 1Fl
- 155-24 113th Ave
- 15545 Linden Blvd
- 15607 113th Ave
- 156-03 113th Ave
- 15609 113th Ave