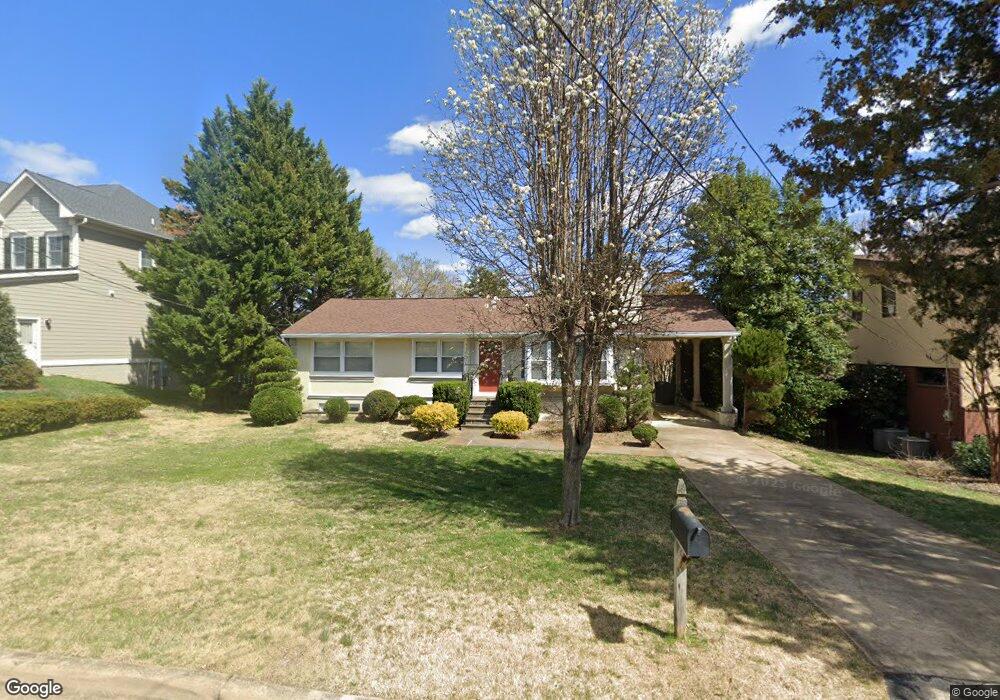
1561 Mcneer St McLean, VA 22101
Estimated Value: $1,164,000 - $1,302,000
5
Beds
4
Baths
1,125
Sq Ft
$1,076/Sq Ft
Est. Value
About This Home
This home is located at 1561 Mcneer St, McLean, VA 22101 and is currently estimated at $1,210,390, approximately $1,075 per square foot. 1561 Mcneer St is a home located in Fairfax County with nearby schools including Kent Gardens Elementary School, Longfellow Middle School, and McLean High School.
Ownership History
Date
Name
Owned For
Owner Type
Purchase Details
Closed on
Sep 16, 2003
Sold by
Staleri Gisella
Bought by
Ham Sung B
Current Estimated Value
Home Financials for this Owner
Home Financials are based on the most recent Mortgage that was taken out on this home.
Original Mortgage
$362,500
Outstanding Balance
$167,933
Interest Rate
6.22%
Mortgage Type
New Conventional
Estimated Equity
$1,042,457
Purchase Details
Closed on
Sep 15, 2000
Sold by
Huynh Khanh Cong
Bought by
Stalteri Renato
Home Financials for this Owner
Home Financials are based on the most recent Mortgage that was taken out on this home.
Original Mortgage
$200,000
Interest Rate
8%
Mortgage Type
Purchase Money Mortgage
Purchase Details
Closed on
Sep 14, 2000
Sold by
Butt Abid W
Bought by
Huynh Khanh Cong
Home Financials for this Owner
Home Financials are based on the most recent Mortgage that was taken out on this home.
Original Mortgage
$200,000
Interest Rate
8%
Mortgage Type
Purchase Money Mortgage
Create a Home Valuation Report for This Property
The Home Valuation Report is an in-depth analysis detailing your home's value as well as a comparison with similar homes in the area
Home Values in the Area
Average Home Value in this Area
Purchase History
| Date | Buyer | Sale Price | Title Company |
|---|---|---|---|
| Ham Sung B | $575,000 | -- | |
| Stalteri Renato | $253,000 | -- | |
| Huynh Khanh Cong | $220,000 | -- |
Source: Public Records
Mortgage History
| Date | Status | Borrower | Loan Amount |
|---|---|---|---|
| Open | Ham Sung B | $362,500 | |
| Previous Owner | Stalteri Renato | $200,000 |
Source: Public Records
Tax History
| Year | Tax Paid | Tax Assessment Tax Assessment Total Assessment is a certain percentage of the fair market value that is determined by local assessors to be the total taxable value of land and additions on the property. | Land | Improvement |
|---|---|---|---|---|
| 2025 | $11,912 | $1,083,110 | $600,000 | $483,110 |
| 2024 | $11,912 | $961,270 | $585,000 | $376,270 |
| 2023 | $11,375 | $945,270 | $585,000 | $360,270 |
| 2022 | $10,298 | $842,110 | $485,000 | $357,110 |
| 2021 | $9,307 | $777,850 | $453,000 | $324,850 |
| 2020 | $9,072 | $751,900 | $453,000 | $298,900 |
| 2019 | $8,785 | $728,170 | $440,000 | $288,170 |
| 2018 | $8,341 | $725,320 | $440,000 | $285,320 |
| 2017 | $8,184 | $691,200 | $431,000 | $260,200 |
| 2016 | $8,248 | $698,120 | $431,000 | $267,120 |
Source: Public Records
Map
Nearby Homes
- 1537 Cedar Ave
- 1573 Westmoreland St
- 1566B Westmoreland St
- 1605 Dunterry Place
- 6654 Chilton Ct
- 6718 Lowell Ave Unit 406
- 6718 Lowell Ave Unit PH 906
- 6718 Lowell Ave Unit 702
- 6718 Lowell Ave Unit 604
- 1601 Wrightson Dr
- 1620 Chain Bridge Rd
- 1622 Chain Bridge Rd
- 1626 Chain Bridge Rd
- 1624 Chain Bridge Rd
- 7040 Liberty Ln
- 7043 Liberty Ln
- 1632 Chain Bridge Rd Unit 20
- 7047 Liberty Ln Unit 32
- 7049 Liberty Ln
- 7054 Liberty Ln
- 1563 Mcneer St
- 1559 Mcneer St
- 6809 Tennyson Dr
- 6811 Tennyson Dr
- 1565 Mcneer St
- 1560 Mcneer St
- 1564 Mcneer St
- 6811 Wise St
- 6807 Tennyson Dr
- 6813 Tennyson Dr
- 1567 Mcneer St
- 6812 Wise St
- 1566 Mcneer St
- 6813 Wise St
- 6810 Tennyson Dr
- 6815 Tennyson Dr
- 6805 Tennyson Dr
- 6812 Tennyson Dr
- 6804 Dillon Ave
- 6814 Wise St
Your Personal Tour Guide
Ask me questions while you tour the home.