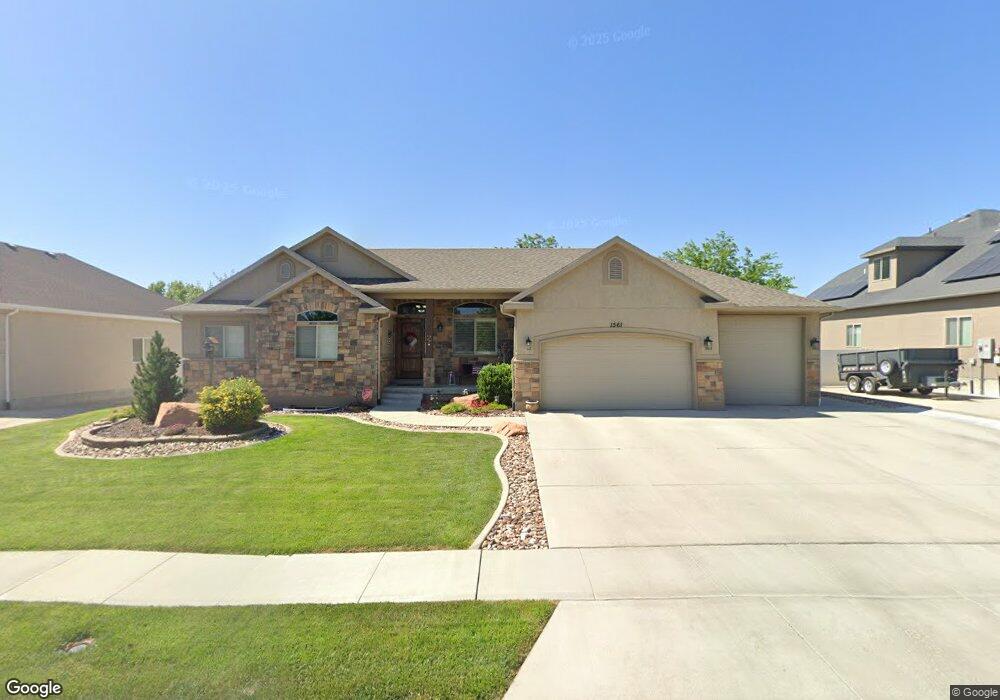
1561 Misty Fen Way West Jordan, UT 84088
Estimated Value: $758,000 - $901,000
6
Beds
4
Baths
2,049
Sq Ft
$405/Sq Ft
Est. Value
About This Home
This home is located at 1561 Misty Fen Way, West Jordan, UT 84088 and is currently estimated at $829,039, approximately $404 per square foot. 1561 Misty Fen Way is a home located in Salt Lake County with nearby schools including Riverside Elementary School, West Jordan Middle School, and West Jordan High School.
Ownership History
Date
Name
Owned For
Owner Type
Purchase Details
Closed on
Nov 3, 2025
Sold by
Anderson Vicki
Bought by
V Anderson Family Trust and Anderson
Current Estimated Value
Purchase Details
Closed on
Mar 31, 2020
Sold by
Anderson Raymond D
Bought by
Anderson Raymond D and Anderson Vicki
Home Financials for this Owner
Home Financials are based on the most recent Mortgage that was taken out on this home.
Original Mortgage
$215,000
Interest Rate
3.4%
Mortgage Type
Credit Line Revolving
Purchase Details
Closed on
Oct 15, 2003
Sold by
Donald S Beckstrand Family Lp
Bought by
Anderson Raymond D and Anderson Vicki
Home Financials for this Owner
Home Financials are based on the most recent Mortgage that was taken out on this home.
Original Mortgage
$235,800
Interest Rate
5.5%
Mortgage Type
Construction
Create a Home Valuation Report for This Property
The Home Valuation Report is an in-depth analysis detailing your home's value as well as a comparison with similar homes in the area
Home Values in the Area
Average Home Value in this Area
Purchase History
| Date | Buyer | Sale Price | Title Company |
|---|---|---|---|
| V Anderson Family Trust | -- | None Listed On Document | |
| Anderson Raymond D | -- | First American Title Ins Api | |
| Anderson Raymond D | -- | First American Title Ins Api | |
| Anderson Raymond D | -- | Sutherland Title |
Source: Public Records
Mortgage History
| Date | Status | Borrower | Loan Amount |
|---|---|---|---|
| Previous Owner | Anderson Raymond D | $215,000 | |
| Previous Owner | Anderson Raymond D | $235,800 |
Source: Public Records
Tax History Compared to Growth
Tax History
| Year | Tax Paid | Tax Assessment Tax Assessment Total Assessment is a certain percentage of the fair market value that is determined by local assessors to be the total taxable value of land and additions on the property. | Land | Improvement |
|---|---|---|---|---|
| 2025 | $4,017 | $759,300 | $145,000 | $614,300 |
| 2024 | $4,017 | $772,800 | $143,500 | $629,300 |
| 2023 | $4,017 | $703,800 | $129,300 | $574,500 |
| 2022 | $3,975 | $709,200 | $126,700 | $582,500 |
| 2021 | $3,212 | $521,600 | $95,000 | $426,600 |
| 2020 | $3,135 | $477,800 | $95,000 | $382,800 |
| 2019 | $3,135 | $468,500 | $95,000 | $373,500 |
| 2018 | $2,975 | $441,000 | $93,800 | $347,200 |
| 2017 | $2,877 | $424,600 | $93,800 | $330,800 |
| 2016 | $2,873 | $398,300 | $93,800 | $304,500 |
| 2015 | $2,843 | $384,400 | $95,600 | $288,800 |
| 2014 | $2,726 | $362,900 | $91,100 | $271,800 |
Source: Public Records
Map
Nearby Homes
- 1673 Peaceful Cir
- 9511 S Tirado Cove Unit 204
- Brook Haven Plan at Jordan Woods
- Maple Plan at Jordan Woods
- The Maple Basement Plan at Jordan Woods
- The Evergreen Basement Plan at Jordan Woods
- 9503 S Tirado Cove Unit 203
- 8686 S Temple Dr
- 1753 Rylie Ann Cir
- 1719 W Brocious Way Unit 301
- 9635 S 1600 W
- 9141 S Little Creek Dr
- 1741 W Nikos Ln
- 9496 S 1930 W
- 1718 W Thira Ln
- 1968 W 9270 S Unit C
- 9414 S 1980 W
- 1788 W Ikaros Ln
- 1767 W Ikaros Ln
- 9252 S 2040 W Unit D
- 1575 Misty Fen Way
- 1575 W Misty Fen Way
- 1547 W Misty Fen Way
- 1547 Misty Fen Way
- 1582 Heather Downs Cir
- 1582 W Heather Downs Cir
- 1587 Misty Fen Way
- 1533 Misty Fen Way
- 1562 Misty Fen Way
- 1562 W Misty Fen Way
- 1576 Misty Fen Way
- 1576 W Misty Fen Way
- 1548 Misty Fen Way
- 9428 Dunbar Cove
- 1588 Heather Downs Cir
- 1576 Heather Downs Cir
- 1576 W Heather Downs Cir
- 1576 W 9425 S
- 1456 W 9380 S Unit 37
- 1588 W Misty Fen Way