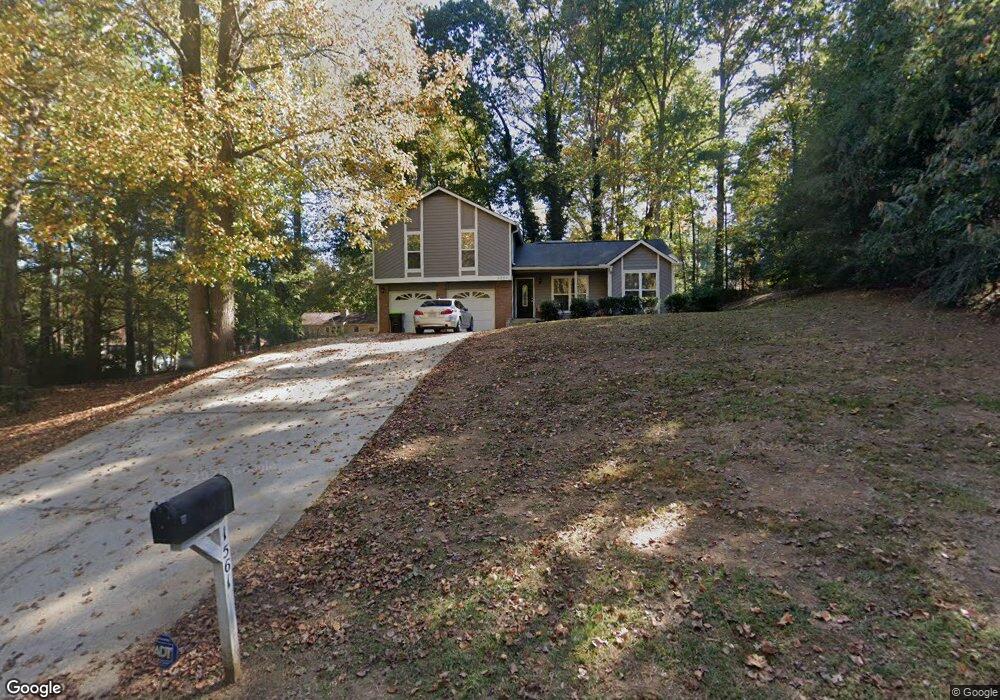
1561 Pin Oak Ln SE Unit 209 Conyers, GA 30094
Estimated Value: $235,845 - $257,000
3
Beds
2
Baths
1,284
Sq Ft
$190/Sq Ft
Est. Value
About This Home
This home is located at 1561 Pin Oak Ln SE Unit 209, Conyers, GA 30094 and is currently estimated at $243,961, approximately $190 per square foot. 1561 Pin Oak Ln SE Unit 209 is a home located in Rockdale County with nearby schools including Sims Elementary School, Edwards Middle School, and Heritage High School.
Ownership History
Date
Name
Owned For
Owner Type
Purchase Details
Closed on
Apr 17, 2018
Sold by
Tmc Svcs Llc
Bought by
Clarke Dwayne
Current Estimated Value
Home Financials for this Owner
Home Financials are based on the most recent Mortgage that was taken out on this home.
Original Mortgage
$114,468
Outstanding Balance
$99,139
Interest Rate
4.75%
Mortgage Type
FHA
Estimated Equity
$144,822
Purchase Details
Closed on
Oct 31, 2017
Sold by
Mse Sub I Llc
Bought by
Tmc Svcs Llc
Purchase Details
Closed on
Dec 23, 2016
Sold by
Arwl 2014 & 1 Trust
Bought by
Mse Sub I Llc
Purchase Details
Closed on
Mar 9, 2015
Sold by
Hs Property Owner Llc
Bought by
Arwl 2014 1 Trust and C/O Apollo Management
Purchase Details
Closed on
Jan 13, 1995
Sold by
Dozier Christy
Bought by
Camp Randolph
Home Financials for this Owner
Home Financials are based on the most recent Mortgage that was taken out on this home.
Original Mortgage
$73,338
Interest Rate
9.5%
Mortgage Type
VA
Create a Home Valuation Report for This Property
The Home Valuation Report is an in-depth analysis detailing your home's value as well as a comparison with similar homes in the area
Home Values in the Area
Average Home Value in this Area
Purchase History
| Date | Buyer | Sale Price | Title Company |
|---|---|---|---|
| Clarke Dwayne | $125,000 | -- | |
| Tmc Svcs Llc | $65,000 | -- | |
| Mse Sub I Llc | $48,650 | -- | |
| Arwl 2014 1 Trust | $94,900 | -- | |
| Camp Randolph | $71,900 | -- |
Source: Public Records
Mortgage History
| Date | Status | Borrower | Loan Amount |
|---|---|---|---|
| Open | Clarke Dwayne | $114,468 | |
| Previous Owner | Camp Randolph | $73,338 |
Source: Public Records
Tax History Compared to Growth
Tax History
| Year | Tax Paid | Tax Assessment Tax Assessment Total Assessment is a certain percentage of the fair market value that is determined by local assessors to be the total taxable value of land and additions on the property. | Land | Improvement |
|---|---|---|---|---|
| 2024 | $4,161 | $104,600 | $17,600 | $87,000 |
| 2023 | $4,248 | $104,160 | $20,400 | $83,760 |
| 2022 | $3,462 | $84,360 | $16,560 | $67,800 |
| 2021 | $2,835 | $69,360 | $11,600 | $57,760 |
| 2020 | $2,533 | $59,440 | $10,000 | $49,440 |
| 2019 | $2,097 | $46,720 | $6,000 | $40,720 |
| 2018 | $1,670 | $37,040 | $6,000 | $31,040 |
| 2017 | $1,842 | $40,480 | $6,000 | $34,480 |
| 2016 | $1,587 | $34,880 | $6,000 | $28,880 |
| 2015 | $911 | $20,000 | $4,027 | $15,973 |
| 2014 | $1,052 | $22,840 | $4,600 | $18,240 |
| 2013 | -- | $32,640 | $7,200 | $25,440 |
Source: Public Records
Map
Nearby Homes
- 2631 Rolling Hills Way SE
- 340 Windsor Walk SE
- 1420 Hillside Place SE
- 1601 Creek Crossing SE
- 1508 Hillside Dr SE
- 309 Windsor Walk SE Unit 1
- 1511 Hillside Dr SE
- 2617 Laurel Woods Ln SE Unit 3
- 2537 Lennox Rd SE
- 2608 Downing Park Dr SE
- 2717 Stanton Woods Dr SE
- 2464 Lennox Rd SE
- 250 Smile Dr SE
- Boston Plan at Millers Pointe
- Atlanta Plan at Millers Pointe
- Columbus Plan at Millers Pointe
- 2370 Ebenezer Rd SE
- 784 Stieff Ct SE
- 574 Almand Branch Rd SE Unit 1
- 2851 Stanton Rd SE
- 1561 Pin Oak Ln SE
- 1740 Rolling Hills Trail SE
- 1551 Pin Oak Ln SE
- 1571 Pin Oak Ln SE
- 1750 Rolling Hills Trail SE
- 1730 Rolling Hills Trail SE
- 1570 Pin Oak Ln SE
- 1760 Rolling Hills Trail SE
- 1581 Pin Oak Ln SE
- 1541 Pin Oak Ln SE
- 1560 Pin Oak Ln SE
- 1580 Pin Oak Ln SE
- 1720 Rolling Hills Trail SE
- 1741 Rolling Hills Trail SE
- 1770 Rolling Hills Trail SE
- 1751 Rolling Hills Trail SE
- 385 Windsor Walk SE
- 1731 Rolling Hills Trail SE
- 1761 Rolling Hills Trail SE
- 1761 Rolling Hills Trail SE Unit 2