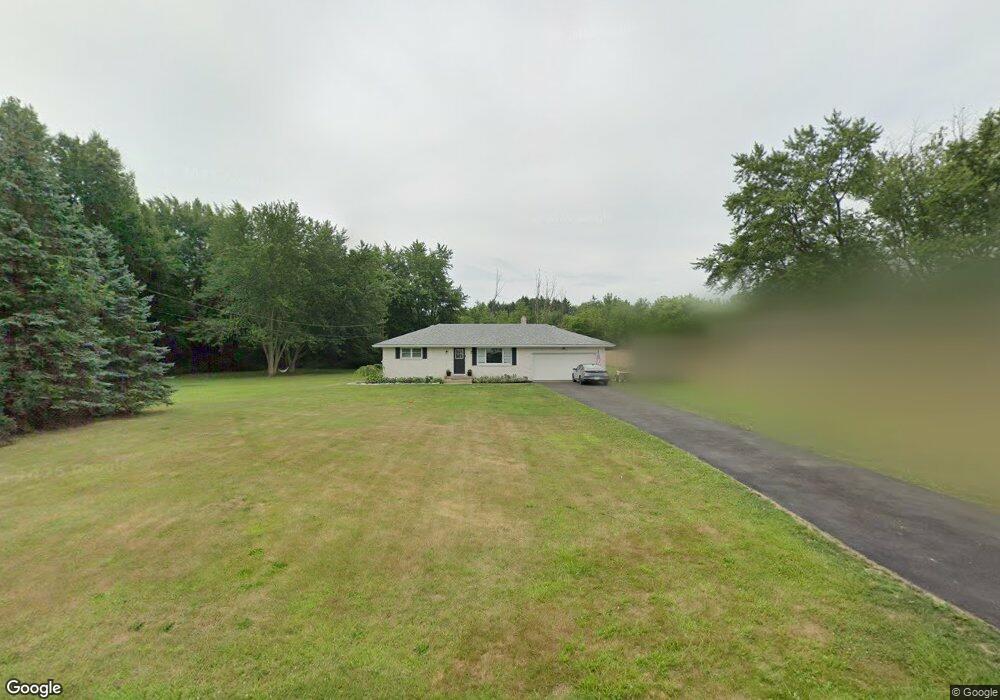
15610 Fairgreen St NE Alliance, OH 44601
Estimated Value: $198,615 - $251,000
2
Beds
1
Bath
962
Sq Ft
$232/Sq Ft
Est. Value
About This Home
This home is located at 15610 Fairgreen St NE, Alliance, OH 44601 and is currently estimated at $223,404, approximately $232 per square foot. 15610 Fairgreen St NE is a home located in Stark County with nearby schools including Marlington High School and New Franklin Christian Academy.
Ownership History
Date
Name
Owned For
Owner Type
Purchase Details
Closed on
May 30, 2013
Sold by
Sommers Elmer E and Sommers Roselette F
Bought by
Beachy Darrin T
Current Estimated Value
Purchase Details
Closed on
Jan 16, 2013
Sold by
Sommers Jared L and Sommers Lori J
Bought by
Sommers Elmr E and Sommers Roselette F
Purchase Details
Closed on
Aug 5, 2005
Sold by
Sommers Elmer E and Sommers Roselette F
Bought by
Sommers Jared I and Sommers Elmer E
Home Financials for this Owner
Home Financials are based on the most recent Mortgage that was taken out on this home.
Original Mortgage
$73,200
Interest Rate
5.66%
Mortgage Type
Fannie Mae Freddie Mac
Create a Home Valuation Report for This Property
The Home Valuation Report is an in-depth analysis detailing your home's value as well as a comparison with similar homes in the area
Home Values in the Area
Average Home Value in this Area
Purchase History
| Date | Buyer | Sale Price | Title Company |
|---|---|---|---|
| Beachy Darrin T | $85,000 | None Available | |
| Sommers Elmr E | -- | None Available | |
| Sommers Jared I | -- | Cresent Title Agency Llc |
Source: Public Records
Mortgage History
| Date | Status | Borrower | Loan Amount |
|---|---|---|---|
| Previous Owner | Sommers Jared I | $73,200 |
Source: Public Records
Tax History Compared to Growth
Tax History
| Year | Tax Paid | Tax Assessment Tax Assessment Total Assessment is a certain percentage of the fair market value that is determined by local assessors to be the total taxable value of land and additions on the property. | Land | Improvement |
|---|---|---|---|---|
| 2025 | -- | $61,120 | $16,000 | $45,120 |
| 2024 | -- | $61,120 | $16,000 | $45,120 |
| 2023 | $1,229 | $39,520 | $10,680 | $28,840 |
| 2022 | $1,233 | $39,520 | $10,680 | $28,840 |
| 2021 | $1,237 | $39,520 | $10,680 | $28,840 |
| 2020 | $1,180 | $33,750 | $9,210 | $24,540 |
| 2019 | $1,170 | $33,750 | $9,210 | $24,540 |
| 2018 | $1,172 | $33,750 | $9,210 | $24,540 |
| 2017 | $1,096 | $29,300 | $9,030 | $20,270 |
| 2016 | $1,074 | $29,300 | $9,030 | $20,270 |
| 2015 | $1,076 | $29,300 | $9,030 | $20,270 |
| 2014 | $1,095 | $27,230 | $8,400 | $18,830 |
| 2013 | $548 | $27,230 | $8,400 | $18,830 |
Source: Public Records
Map
Nearby Homes
- 6378 Union Ave NE
- 6434 Union Ave NE
- 16159 Salem Church St NE
- 5200 Union Ave NE
- 22120 Center Rd
- 540 E Bayton St
- 1299 E Bayton St
- 5869 Beechwood Ave
- 1100 E Bayton St
- 13881 Salem Church St NE
- 3709 S Union Ave
- 256 Laramie St
- 1835 Homeworth Rd
- 277 W Carol St
- 3636 S Mahoning Ave
- 22840 Buck Rd
- 1325 W Beech St
- 22360 Margaret Ln
- 3101 Ridgehill Ave
- 1105 Abbey Ln
- 5870 Union Ave NE
- 5834 Union Ave NE
- 5902 Union Ave NE
- 15670 Fairgreen St NE
- 15611 Fairgreen St NE
- 15611 Fairgreen St NE
- 5920 Union Ave NE
- 15649 Fairgreen St NE
- 5823 Union Ave NE
- 5843 Union Ave NE
- 5803 Union Ave NE
- 5803 Union Ave NE
- 5938 Union Ave NE
- 5776 Union Ave NE
- 5783 Union Ave NE
- 5956 Union Ave NE
- 5871 Union Ave NE
- 5925 Union Ave NE
- 5747 Union Ave NE
- 5951 Union Ave NE