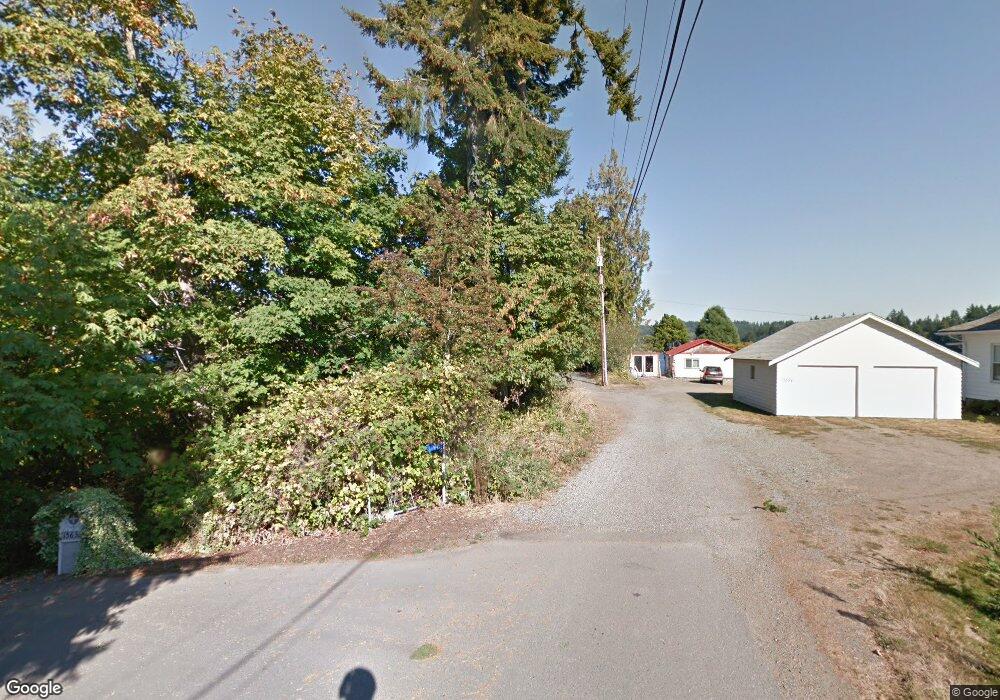
15611 Cove Point Ln NE Keyport, WA 98345
Estimated Value: $256,000 - $898,180
1
Bed
1
Bath
960
Sq Ft
$691/Sq Ft
Est. Value
About This Home
This home is located at 15611 Cove Point Ln NE, Keyport, WA 98345 and is currently estimated at $663,295, approximately $690 per square foot. 15611 Cove Point Ln NE is a home with nearby schools including Hilder Pearson Elementary School, Poulsbo Middle School, and North Kitsap High School.
Ownership History
Date
Name
Owned For
Owner Type
Purchase Details
Closed on
Aug 29, 2025
Sold by
Martin T Crowder Credit Trust and Martin T Crowder Living Trust
Bought by
Crowder Lisa Diane
Current Estimated Value
Home Financials for this Owner
Home Financials are based on the most recent Mortgage that was taken out on this home.
Original Mortgage
$494,000
Outstanding Balance
$494,000
Interest Rate
6.75%
Mortgage Type
New Conventional
Estimated Equity
$169,295
Purchase Details
Closed on
Aug 27, 2025
Sold by
Dunmire Darrell and Crowder Lisa Diane
Bought by
Crowder Lisa Diane
Home Financials for this Owner
Home Financials are based on the most recent Mortgage that was taken out on this home.
Original Mortgage
$494,000
Outstanding Balance
$494,000
Interest Rate
6.75%
Mortgage Type
New Conventional
Estimated Equity
$169,295
Purchase Details
Closed on
Nov 14, 2008
Sold by
Crowder Diane M and Estate Of Martin T Crowder
Bought by
Crowder Diane M and Martin T Crowder Credit Trust
Create a Home Valuation Report for This Property
The Home Valuation Report is an in-depth analysis detailing your home's value as well as a comparison with similar homes in the area
Home Values in the Area
Average Home Value in this Area
Purchase History
| Date | Buyer | Sale Price | Title Company |
|---|---|---|---|
| Crowder Lisa Diane | $520,000 | Pacific Northwest Title | |
| Crowder Lisa Diane | $313 | Pacific Northwest Title | |
| Crowder Lisa Diane | $313 | Pacific Northwest Title | |
| Crowder Diane M | -- | None Available |
Source: Public Records
Mortgage History
| Date | Status | Borrower | Loan Amount |
|---|---|---|---|
| Open | Crowder Lisa Diane | $494,000 |
Source: Public Records
Tax History Compared to Growth
Tax History
| Year | Tax Paid | Tax Assessment Tax Assessment Total Assessment is a certain percentage of the fair market value that is determined by local assessors to be the total taxable value of land and additions on the property. | Land | Improvement |
|---|---|---|---|---|
| 2026 | $6,918 | $770,000 | $556,750 | $213,250 |
| 2025 | $6,918 | $770,000 | $556,750 | $213,250 |
| 2024 | $6,806 | $782,450 | $560,610 | $221,840 |
| 2023 | $6,089 | $686,760 | $508,460 | $178,300 |
| 2022 | $5,372 | $573,500 | $423,720 | $149,780 |
| 2021 | $5,151 | $508,080 | $374,820 | $133,260 |
| 2020 | $4,571 | $442,680 | $325,930 | $116,750 |
| 2019 | $4,579 | $442,680 | $325,930 | $116,750 |
| 2018 | $4,034 | $341,210 | $237,070 | $104,140 |
| 2017 | $3,967 | $341,210 | $237,070 | $104,140 |
| 2016 | $4,297 | $341,210 | $237,070 | $104,140 |
| 2015 | $4,133 | $330,170 | $237,070 | $93,100 |
| 2014 | -- | $314,830 | $237,070 | $77,760 |
| 2013 | -- | $314,830 | $237,070 | $77,760 |
Source: Public Records
Map
Nearby Homes
- 1314 NE South Petterson Rd
- 15485 NE Peterson Rd
- 15809 Virginia Point Rd NE
- 1954 NE Grandview Blvd
- 1922 NE Fir St
- 15739 Virginia Loop Rd NE
- 1533 NE Tagholm Rd
- 1422 NW Swenson Ct
- 1678 NE Jacobson Rd
- 1354 Hoffs Dr
- 16778 Lemolo Shore Dr NE
- 17008 Peterson Way NE
- 2393 NE Trail Way
- 13423 Graywolf Place NE
- 16460 Scandia Rd NW
- 0 XX Lemolo Shore Dr NE
- 0 Lemolo Shore Parcel 4-019 Dr NE
- 17535 NE Midnight Sun Loop
- 13977 Blackberry Ln NE
- 17529 NE Midnight Sun Loop
- 15619 Cove Point Ln NE
- 15607 Cove Point Ln NE
- 15623 Cove Point Ln NE
- 15554 Cove Point Ln NE
- 15490 Cove Point Ln NE
- 15627 Cove Point Ln NE
- 15478 Cove Point Ln NE
- 15631 Cove Point Ln NE
- 15563 Cove Point Ln NE
- 15446 NE Petterson Rd
- 15495 Cove Point Ln NE
- 15406 NE Petterson Rd
- 15485 Cove Point Ln NE
- 15462 Cove Point Ln NE
- 15625 Aland Ln NE
- 15611 Aland Ln NE
- 15481 Cove Point Ln NE
- 15626 Aland Ln NE
- 1318 NE South Petterson Rd
- 15612 Aland Ln NE