15613 Bent Creek Rd Wellington, FL 33414
The Landings at Wellington NeighborhoodEstimated Value: $675,642 - $798,000
--
Bed
3
Baths
2,537
Sq Ft
$294/Sq Ft
Est. Value
About This Home
This home is located at 15613 Bent Creek Rd, Wellington, FL 33414 and is currently estimated at $744,911, approximately $293 per square foot. 15613 Bent Creek Rd is a home located in Palm Beach County with nearby schools including Binks Forest Elementary School, Wellington Landings Middle School, and Wellington High School.
Ownership History
Date
Name
Owned For
Owner Type
Purchase Details
Closed on
Mar 26, 2011
Sold by
Miller Brice and Miller Lorraine
Bought by
Picknell Christopher and Picknell Traci
Current Estimated Value
Home Financials for this Owner
Home Financials are based on the most recent Mortgage that was taken out on this home.
Original Mortgage
$306,400
Outstanding Balance
$210,286
Interest Rate
4.92%
Mortgage Type
New Conventional
Estimated Equity
$534,625
Purchase Details
Closed on
May 10, 2002
Sold by
Newby Lorraine and Newby Robert E
Bought by
Miller Brice and Miller Lorraine
Home Financials for this Owner
Home Financials are based on the most recent Mortgage that was taken out on this home.
Original Mortgage
$115,000
Interest Rate
6.4%
Purchase Details
Closed on
May 31, 1995
Sold by
M I Schottenstein Homes Inc
Bought by
Newby Lorraine
Create a Home Valuation Report for This Property
The Home Valuation Report is an in-depth analysis detailing your home's value as well as a comparison with similar homes in the area
Home Values in the Area
Average Home Value in this Area
Purchase History
| Date | Buyer | Sale Price | Title Company |
|---|---|---|---|
| Picknell Christopher | $383,000 | Esquire Title Inc | |
| Miller Brice | $260,000 | Esquire Title Inc | |
| Newby Lorraine | $233,200 | -- |
Source: Public Records
Mortgage History
| Date | Status | Borrower | Loan Amount |
|---|---|---|---|
| Open | Picknell Christopher | $306,400 | |
| Previous Owner | Miller Brice | $115,000 |
Source: Public Records
Tax History Compared to Growth
Tax History
| Year | Tax Paid | Tax Assessment Tax Assessment Total Assessment is a certain percentage of the fair market value that is determined by local assessors to be the total taxable value of land and additions on the property. | Land | Improvement |
|---|---|---|---|---|
| 2025 | $6,147 | $338,528 | -- | -- |
| 2024 | $6,147 | $328,987 | -- | -- |
| 2023 | $5,983 | $319,405 | $0 | $0 |
| 2022 | $5,819 | $310,102 | $0 | $0 |
| 2021 | $5,732 | $301,070 | $0 | $0 |
| 2020 | $5,654 | $296,913 | $0 | $0 |
| 2019 | $5,580 | $290,238 | $0 | $0 |
| 2018 | $5,328 | $284,826 | $0 | $0 |
| 2017 | $5,270 | $278,968 | $0 | $0 |
| 2016 | $5,270 | $273,230 | $0 | $0 |
| 2015 | $5,385 | $271,331 | $0 | $0 |
| 2014 | $5,413 | $269,178 | $0 | $0 |
Source: Public Records
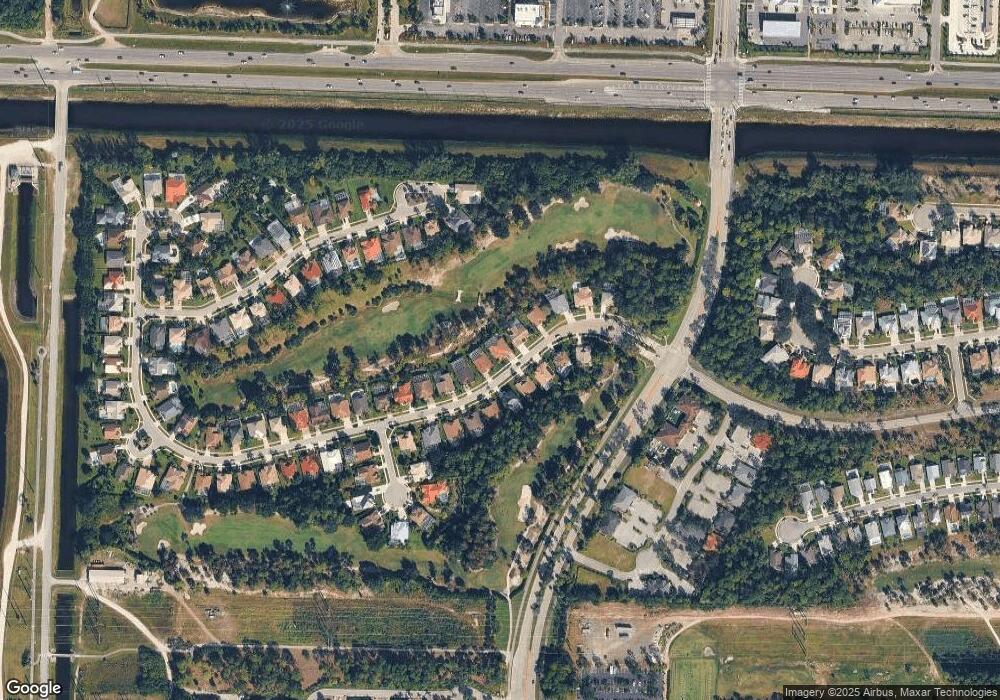
Map
Nearby Homes
- 15814 Bent Creek Rd
- 180 Sword Fern Place
- 15608 Italian Cypress Way
- 15688 Italian Cypress Way
- 15157 Oak Chase Ct
- 15816 Italian Cypress Way
- 486 Cypress Green Cir
- 15055 Oak Chase Ct
- 15032 Oak Chase Ct
- 103 Squire Dr
- 15643 Cypress Park Dr
- 750 Cedar Cove Rd
- 14745 Haymarket Ct
- 14708 Stirrup Ln
- 14823 Horseshoe Trace
- 704 Deerwood Ct
- 728 Deerwood Ct
- 14779 Paddock Dr
- 14845 Collecting Canal Rd
- 14817 Paddock Dr
- 15621 Bent Creek Rd
- 15573 Bent Creek Rd
- 15590 Bent Creek Rd
- 15629 Bent Creek Rd
- 15597 Bent Creek Rd
- 15614 Bent Creek Rd
- 15606 Bent Creek Rd
- 15622 Bent Creek Rd
- 15605 Bent Creek Rd
- 15637 Bent Creek Rd
- 15598 Bent Creek Rd
- 15589 Bent Creek Rd
- 15636 Bent Creek Rd
- 15645 Bent Creek Rd
- 15630 Bent Creek Rd
- 15640 Bent Creek Rd
- 15581 Bent Creek Rd
- 15646 Bent Creek Rd
- 15653 Bent Creek Rd
- 15661 Bent Creek Rd