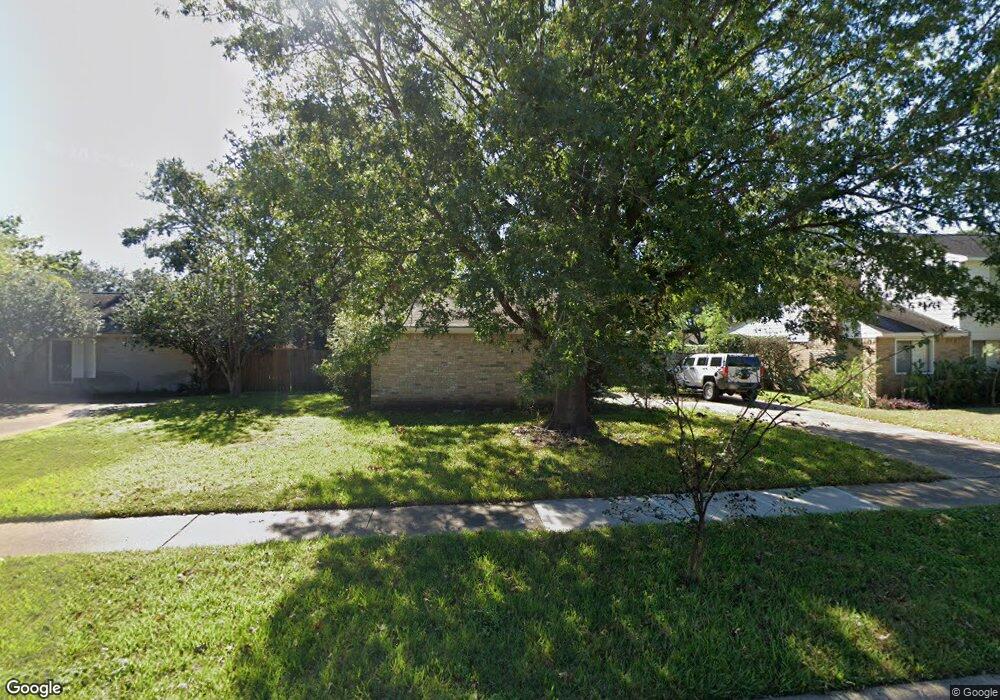
15615 Meadow Village Dr Houston, TX 77095
Estimated Value: $237,000 - $253,000
3
Beds
2
Baths
1,504
Sq Ft
$162/Sq Ft
Est. Value
About This Home
This home is located at 15615 Meadow Village Dr, Houston, TX 77095 and is currently estimated at $243,042, approximately $161 per square foot. 15615 Meadow Village Dr is a home located in Harris County with nearby schools including Fiest Elementary School, Labay Middle School, and Cypress Falls High School.
Ownership History
Date
Name
Owned For
Owner Type
Purchase Details
Closed on
Sep 16, 2015
Sold by
Butcher Diana L
Bought by
Lafferty Randy J
Current Estimated Value
Home Financials for this Owner
Home Financials are based on the most recent Mortgage that was taken out on this home.
Original Mortgage
$97,400
Outstanding Balance
$76,527
Interest Rate
3.92%
Mortgage Type
New Conventional
Estimated Equity
$166,515
Purchase Details
Closed on
May 23, 1996
Sold by
Roberts Patrick J and Nelson Susan S
Bought by
Butcher Diana L
Home Financials for this Owner
Home Financials are based on the most recent Mortgage that was taken out on this home.
Original Mortgage
$56,800
Interest Rate
7.93%
Purchase Details
Closed on
Nov 1, 1994
Sold by
Dusek Edward J and Dusek Martha M
Bought by
Citimae Inc
Create a Home Valuation Report for This Property
The Home Valuation Report is an in-depth analysis detailing your home's value as well as a comparison with similar homes in the area
Home Values in the Area
Average Home Value in this Area
Purchase History
| Date | Buyer | Sale Price | Title Company |
|---|---|---|---|
| Lafferty Randy J | -- | Providence Title Co | |
| Butcher Diana L | -- | -- | |
| Citimae Inc | $61,864 | -- |
Source: Public Records
Mortgage History
| Date | Status | Borrower | Loan Amount |
|---|---|---|---|
| Open | Lafferty Randy J | $97,400 | |
| Previous Owner | Butcher Diana L | $56,800 |
Source: Public Records
Tax History Compared to Growth
Tax History
| Year | Tax Paid | Tax Assessment Tax Assessment Total Assessment is a certain percentage of the fair market value that is determined by local assessors to be the total taxable value of land and additions on the property. | Land | Improvement |
|---|---|---|---|---|
| 2025 | $5,106 | $221,746 | $55,474 | $166,272 |
| 2024 | $5,106 | $223,297 | $55,474 | $167,823 |
| 2023 | $5,106 | $216,973 | $55,474 | $161,499 |
| 2022 | $5,022 | $202,555 | $50,551 | $152,004 |
| 2021 | $4,505 | $172,144 | $50,551 | $121,593 |
| 2020 | $4,688 | $173,179 | $42,016 | $131,163 |
| 2019 | $4,380 | $157,082 | $27,245 | $129,837 |
| 2018 | $2,052 | $142,482 | $27,245 | $115,237 |
| 2017 | $3,973 | $142,482 | $27,245 | $115,237 |
| 2016 | $3,973 | $142,482 | $27,245 | $115,237 |
| 2015 | $2,443 | $129,114 | $27,245 | $101,869 |
| 2014 | $2,443 | $114,324 | $22,649 | $91,675 |
Source: Public Records
Map
Nearby Homes
- 15611 Meadow Village Dr
- 15415 Swan Creek Dr
- 15414 Swan Creek Dr
- 15339 Glenwood Park Dr
- 15362 Meadow Village Dr
- 15634 Haleys Landing Ln
- 8526 Greenleaf Lake Dr
- 8211 Riverglade Dr
- 15610 Tarpon Springs Ct
- 8203 Green Devon Dr
- 15610 Manorford Ct
- 15735 Jamie Lee Dr
- 15627 Kentwater Ct
- 8526 Hot Springs Dr
- 8306 Lake Crystal Dr
- 15954 Oak Mountain Dr
- 15918 Pinyon Creek Dr
- 15010 Chetland Place Dr
- 9303 Reston Grove Ln
- 9111 Baber Dr
- 15619 Meadow Village Dr
- 15607 Meadow Village Dr
- 15623 Meadow Village Dr
- 15614 Meadow Village Dr
- 15618 Meadow Village Dr
- 15610 Meadow Village Dr
- 15603 Meadow Village Dr
- 15627 Meadow Village Dr
- 15622 Meadow Village Dr
- 15502 Windy Cove Dr
- 15422 Windy Cove Dr
- 15606 Meadow Village Dr
- 15510 Windy Cove Dr
- 15626 Meadow Village Dr
- 15531 Meadow Village Dr
- 15602 Meadow Village Dr
- 15619 Highfield Dr
- 15615 Highfield Dr
- 15514 Windy Cove Dr
- 15623 Highfield Dr