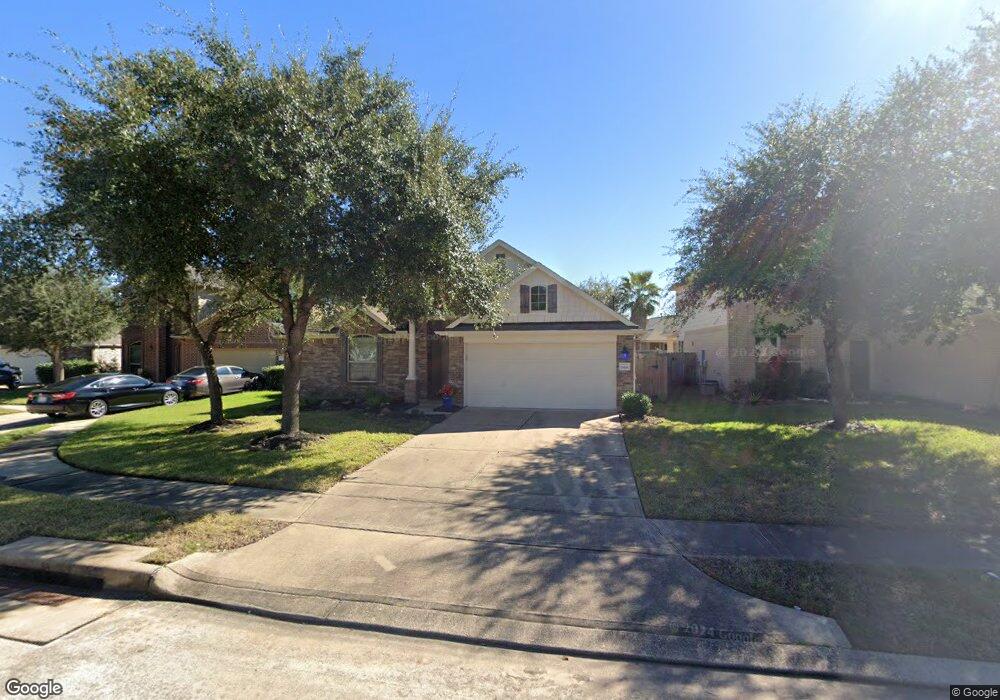
15618 Mossy Park Cypress, TX 77429
Estimated Value: $296,231 - $321,000
3
Beds
2
Baths
1,901
Sq Ft
$164/Sq Ft
Est. Value
About This Home
This home is located at 15618 Mossy Park, Cypress, TX 77429 and is currently estimated at $311,558, approximately $163 per square foot. 15618 Mossy Park is a home located in Harris County with nearby schools including Black Elementary School, Goodson Middle, and Cypress Woods High School.
Ownership History
Date
Name
Owned For
Owner Type
Purchase Details
Closed on
Jun 15, 2016
Sold by
Cordaus Andrew Paul and Cordaus Sherrell Ellyn
Bought by
Murphy Kimberly C
Current Estimated Value
Home Financials for this Owner
Home Financials are based on the most recent Mortgage that was taken out on this home.
Original Mortgage
$165,750
Outstanding Balance
$132,090
Interest Rate
3.61%
Mortgage Type
New Conventional
Estimated Equity
$179,468
Purchase Details
Closed on
Nov 13, 2009
Sold by
Mhi Partnership Ltd
Bought by
Cordas Andrew Paul and Cordas Sherrell Ellyn
Home Financials for this Owner
Home Financials are based on the most recent Mortgage that was taken out on this home.
Original Mortgage
$148,087
Interest Rate
4.83%
Mortgage Type
FHA
Create a Home Valuation Report for This Property
The Home Valuation Report is an in-depth analysis detailing your home's value as well as a comparison with similar homes in the area
Home Values in the Area
Average Home Value in this Area
Purchase History
| Date | Buyer | Sale Price | Title Company |
|---|---|---|---|
| Murphy Kimberly C | -- | Providence Title Co | |
| Cordas Andrew Paul | -- | Millennium Title Houston |
Source: Public Records
Mortgage History
| Date | Status | Borrower | Loan Amount |
|---|---|---|---|
| Open | Murphy Kimberly C | $165,750 | |
| Previous Owner | Cordas Andrew Paul | $148,087 |
Source: Public Records
Tax History Compared to Growth
Tax History
| Year | Tax Paid | Tax Assessment Tax Assessment Total Assessment is a certain percentage of the fair market value that is determined by local assessors to be the total taxable value of land and additions on the property. | Land | Improvement |
|---|---|---|---|---|
| 2025 | $4,976 | $303,806 | $60,280 | $243,526 |
| 2024 | $4,976 | $304,999 | $60,280 | $244,719 |
| 2023 | $4,976 | $329,058 | $60,280 | $268,778 |
| 2022 | $6,296 | $276,613 | $46,436 | $230,177 |
| 2021 | $5,992 | $226,902 | $46,436 | $180,466 |
| 2020 | $5,572 | $198,000 | $35,764 | $162,236 |
| 2019 | $5,647 | $195,000 | $34,610 | $160,390 |
| 2018 | $1,886 | $195,000 | $34,610 | $160,390 |
| 2017 | $5,745 | $195,000 | $34,610 | $160,390 |
| 2016 | $5,607 | $190,314 | $28,842 | $161,472 |
| 2015 | $4,133 | $183,602 | $28,842 | $154,760 |
| 2014 | $4,133 | $162,739 | $28,842 | $133,897 |
Source: Public Records
Map
Nearby Homes
- 16811 Chaco Canyon Ct
- 15706 Whispering Green Dr
- 15607 Whispering Green Dr
- 16107 Heights Harvest Ln
- 16915 Tranquility Park Dr
- 17010 Cypress Knee Dr
- 16218 Range Valley Ln
- 15211 Sunlight Bay Ct
- 17027 Wild Turkey Dr
- 15826 Stable Creek Cir
- 15834 Aldridge Creek Ct
- 16003 Cypress Farms Dr
- 16515 Nightingale Falls Ct
- 15719 Pinedell Dr
- 16107 Dusty Path Ln
- 16003 Roseview Ln
- 14806 Cypress Timber Dr
- 16551 Cypress Bridge Dr
- 16211 Charolais Dr
- 16502 Barker Ranch Ct
- 15614 Mossy Park
- 15622 Mossy Park
- 15610 Mossy Park
- 15611 Bluff Park Ct
- 15607 Bluff Park Ct
- 15626 Mossy Park
- 15615 Bluff Park Ct
- 15623 Mossy Park
- 15606 Mossy Park
- 15619 Bluff Park Ct
- 15619 Mossy Park
- 16802 Ranger Ridge
- 16802 Ranger Ridge Dr
- 15615 Mossy Park
- 16806 Ranger Ridge
- 16810 Ranger Ridge
- 16810 Ranger Ridge Unit DR
- 15623 Bluff Park Ct
- 16814 Ranger Ridge
- 15611 Mossy Park