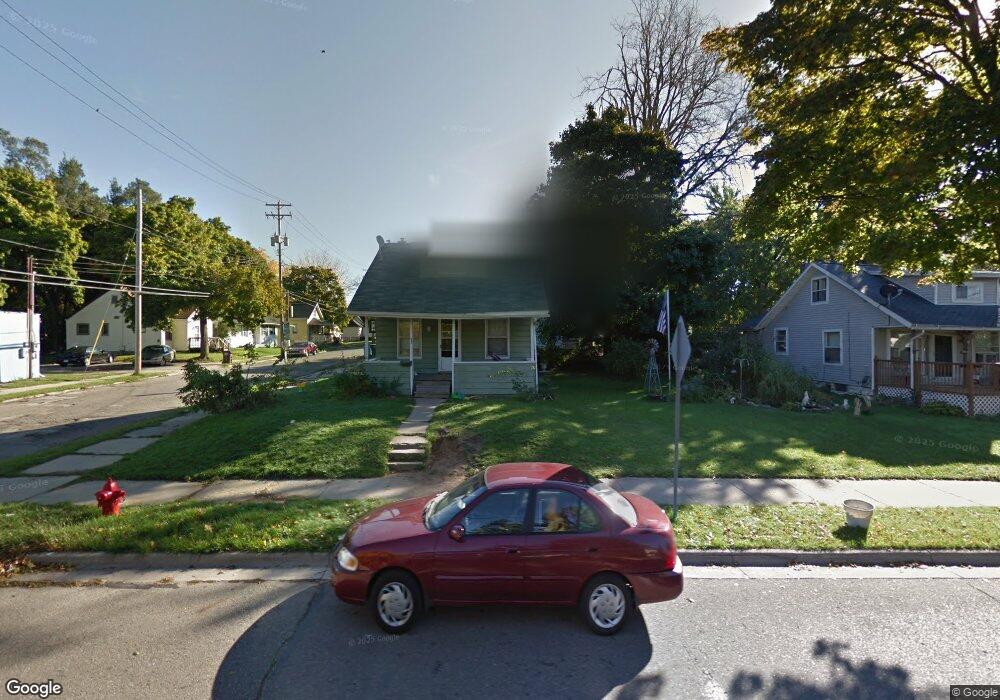
1562 N High St Lansing, MI 48906
Northtown NeighborhoodEstimated Value: $73,000 - $96,000
3
Beds
1
Bath
650
Sq Ft
$130/Sq Ft
Est. Value
About This Home
This home is located at 1562 N High St, Lansing, MI 48906 and is currently estimated at $84,756, approximately $130 per square foot. 1562 N High St is a home located in Ingham County with nearby schools including Willow School, Pattengill Academy, and Eastern High School.
Ownership History
Date
Name
Owned For
Owner Type
Purchase Details
Closed on
Aug 29, 2019
Sold by
512 N Mlk Llc
Bought by
Gridiron Group Llc
Current Estimated Value
Home Financials for this Owner
Home Financials are based on the most recent Mortgage that was taken out on this home.
Original Mortgage
$384,300
Outstanding Balance
$337,305
Interest Rate
3.7%
Mortgage Type
Commercial
Estimated Equity
-$252,549
Purchase Details
Closed on
Aug 3, 2015
Sold by
Gridiron Marketing Group Llc
Bought by
1562 N High Llc
Purchase Details
Closed on
Jun 24, 2011
Sold by
Mares Felipe A
Bought by
Bishop Cecelia A
Purchase Details
Closed on
Aug 25, 2009
Sold by
Austin Herbert
Bought by
Mares Felipe A and Bishop Cecelia A
Purchase Details
Closed on
Feb 12, 2003
Sold by
Rethamel Dennis
Bought by
Mingus Mark A and Mingus April
Purchase Details
Closed on
Jan 8, 1973
Sold by
Gallimore Lottie B
Bought by
Gallimore Lottie B and Austin Herbert
Create a Home Valuation Report for This Property
The Home Valuation Report is an in-depth analysis detailing your home's value as well as a comparison with similar homes in the area
Home Values in the Area
Average Home Value in this Area
Purchase History
| Date | Buyer | Sale Price | Title Company |
|---|---|---|---|
| Gridiron Group Llc | -- | None Available | |
| 1562 N High Llc | -- | None Available | |
| Bishop Cecelia A | -- | None Available | |
| Mares Felipe A | $10,000 | Continental Title Agency | |
| Mingus Mark A | -- | -- | |
| Gallimore Lottie B | $10,000 | -- |
Source: Public Records
Mortgage History
| Date | Status | Borrower | Loan Amount |
|---|---|---|---|
| Open | Gridiron Group Llc | $384,300 |
Source: Public Records
Tax History Compared to Growth
Tax History
| Year | Tax Paid | Tax Assessment Tax Assessment Total Assessment is a certain percentage of the fair market value that is determined by local assessors to be the total taxable value of land and additions on the property. | Land | Improvement |
|---|---|---|---|---|
| 2025 | $1,590 | $33,000 | $1,700 | $31,300 |
| 2024 | $13 | $27,700 | $1,700 | $26,000 |
| 2023 | $1,498 | $22,600 | $1,700 | $20,900 |
| 2022 | $1,372 | $20,100 | $1,700 | $18,400 |
| 2021 | $1,340 | $17,800 | $2,200 | $15,600 |
| 2020 | $1,330 | $18,000 | $2,200 | $15,800 |
| 2019 | $1,283 | $16,100 | $2,200 | $13,900 |
| 2018 | $1,219 | $15,800 | $2,200 | $13,600 |
| 2017 | $1,329 | $15,800 | $2,200 | $13,600 |
| 2016 | $1,515 | $14,600 | $2,200 | $12,400 |
| 2015 | $1,515 | $14,300 | $4,361 | $9,939 |
| 2014 | $1,515 | $14,200 | $4,361 | $9,839 |
Source: Public Records
Map
Nearby Homes
- 1530 New York Ave
- 1527 Massachusetts Ave
- 1415 New York Ave
- 1407 New York Ave
- 1810 N High St
- 1614 Vermont Ave
- 1318 Massachusetts Ave
- 1811 Vermont Ave
- 1633 Illinois Ave
- 1016 Lake Lansing Rd
- V/L (1036) N Larch St
- 614 Woodbury Ave
- 1141 Farrand St
- 0 Lake Lansing Rd
- 430 Pearl St
- 1922 Polly Ave
- 2318 N High St
- 1323 E César E Chávez Ave
- 417 Liberty St
- 1206 Porter St
- 1008 E North St
- 1010 E North St
- 1556 N High St
- 1552 N High St
- 1009 E North St
- 1014 E North St
- 1014 E N
- 1016 E North St
- 1563 N High St
- 1559 N High St
- 1546 N High St
- 1608 N High St
- 1553 N High St
- 1015 E North St
- 1549 N High St
- 1542 N High St
- 1021 E North St
- 1610 N High St
- 1545 N High St
- 1614 N High St