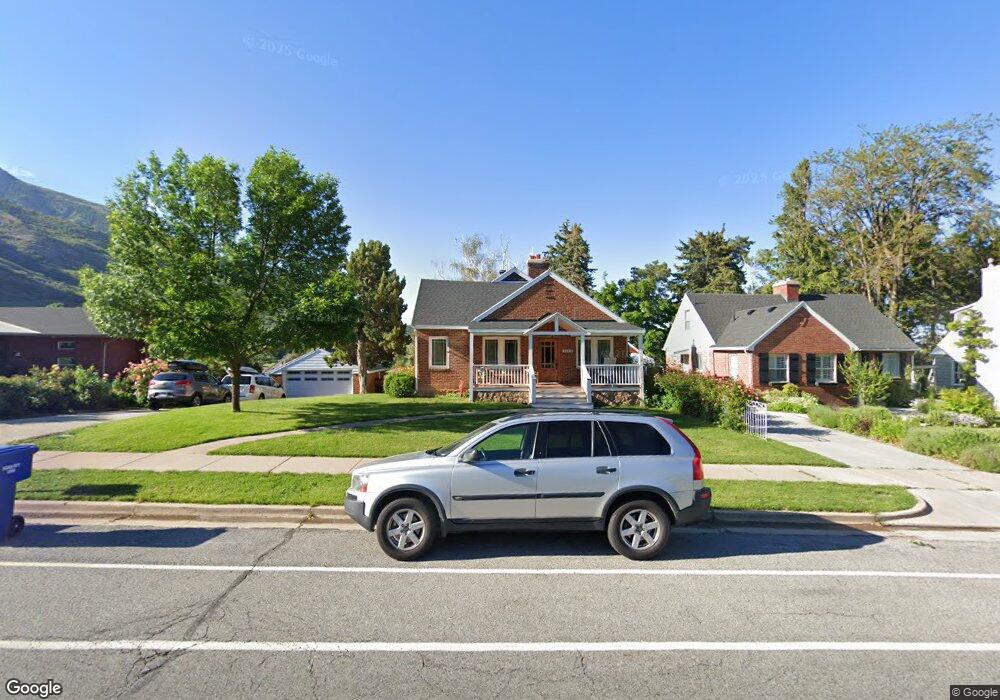
1563 29th St Ogden, UT 84403
Mount Ogden NeighborhoodEstimated Value: $538,000 - $595,000
4
Beds
2
Baths
2,500
Sq Ft
$223/Sq Ft
Est. Value
About This Home
This home is located at 1563 29th St, Ogden, UT 84403 and is currently estimated at $557,255, approximately $222 per square foot. 1563 29th St is a home located in Weber County with nearby schools including Wasatch Elementary School, Mount Ogden Junior High School, and Ogden High School.
Ownership History
Date
Name
Owned For
Owner Type
Purchase Details
Closed on
May 23, 2007
Sold by
Kotter Steven A and Kotter Christa
Bought by
Guimond Paul and Putnam Alison B
Current Estimated Value
Home Financials for this Owner
Home Financials are based on the most recent Mortgage that was taken out on this home.
Original Mortgage
$180,000
Outstanding Balance
$109,189
Interest Rate
6.12%
Mortgage Type
Purchase Money Mortgage
Estimated Equity
$448,066
Purchase Details
Closed on
Jul 1, 2005
Sold by
Whittier Christian
Bought by
Kotter Steven A and Kotter Christa
Home Financials for this Owner
Home Financials are based on the most recent Mortgage that was taken out on this home.
Original Mortgage
$148,200
Interest Rate
5.58%
Mortgage Type
Purchase Money Mortgage
Purchase Details
Closed on
Jun 2, 2005
Sold by
Dellamar Mary L
Bought by
Whittier Christian
Home Financials for this Owner
Home Financials are based on the most recent Mortgage that was taken out on this home.
Original Mortgage
$148,200
Interest Rate
5.58%
Mortgage Type
Purchase Money Mortgage
Create a Home Valuation Report for This Property
The Home Valuation Report is an in-depth analysis detailing your home's value as well as a comparison with similar homes in the area
Home Values in the Area
Average Home Value in this Area
Purchase History
| Date | Buyer | Sale Price | Title Company |
|---|---|---|---|
| Guimond Paul | -- | First American Title Ridgeli | |
| Kotter Steven A | -- | Equity Title South Ogden | |
| Whittier Christian | -- | -- |
Source: Public Records
Mortgage History
| Date | Status | Borrower | Loan Amount |
|---|---|---|---|
| Open | Guimond Paul | $180,000 | |
| Previous Owner | Kotter Steven A | $148,200 | |
| Previous Owner | Whittier Christian | $144,750 |
Source: Public Records
Tax History
| Year | Tax Paid | Tax Assessment Tax Assessment Total Assessment is a certain percentage of the fair market value that is determined by local assessors to be the total taxable value of land and additions on the property. | Land | Improvement |
|---|---|---|---|---|
| 2025 | $3,924 | $518,864 | $168,011 | $350,853 |
| 2024 | $3,893 | $278,848 | $92,406 | $186,442 |
| 2023 | $3,460 | $248,600 | $88,467 | $160,133 |
| 2022 | $3,621 | $264,550 | $77,784 | $186,766 |
| 2021 | $3,433 | $415,000 | $76,302 | $338,698 |
| 2020 | $3,055 | $338,000 | $58,295 | $279,705 |
| 2019 | $2,983 | $309,001 | $55,875 | $253,126 |
| 2018 | $2,861 | $294,000 | $55,875 | $238,125 |
| 2017 | $2,526 | $239,000 | $55,875 | $183,125 |
| 2016 | $2,260 | $114,204 | $24,052 | $90,152 |
| 2015 | $2,079 | $101,647 | $24,052 | $77,595 |
| 2014 | $2,042 | $98,627 | $24,052 | $74,575 |
Source: Public Records
Map
Nearby Homes
Your Personal Tour Guide
Ask me questions while you tour the home.