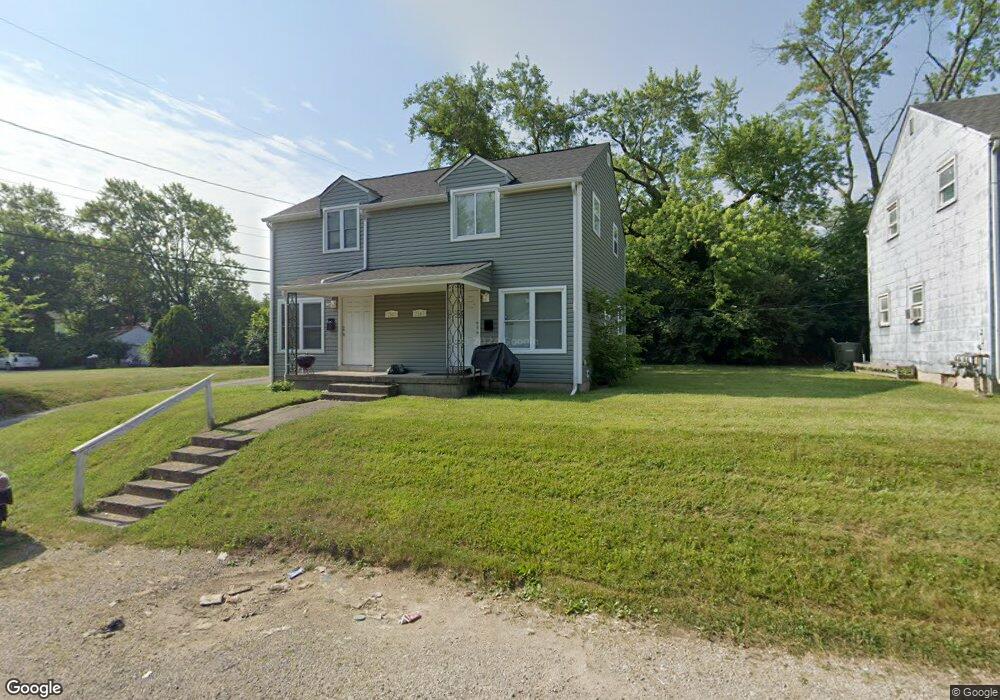
1563 Gault St Unit 1563-1565 Columbus, OH 43205
Driving Park NeighborhoodEstimated Value: $205,738 - $324,000
4
Beds
2
Baths
1,664
Sq Ft
$159/Sq Ft
Est. Value
About This Home
This home is located at 1563 Gault St Unit 1563-1565, Columbus, OH 43205 and is currently estimated at $264,185, approximately $158 per square foot. 1563 Gault St Unit 1563-1565 is a home located in Franklin County with nearby schools including Fairwood Alternative Elementary School, South High School, and Capital Collegiate Preparatory Academy.
Ownership History
Date
Name
Owned For
Owner Type
Purchase Details
Closed on
Feb 22, 2016
Sold by
Equity Trust Co
Bought by
Genesis Management Group Llc
Current Estimated Value
Purchase Details
Closed on
Jan 19, 2016
Sold by
Hogar Community Reinvestment Llc
Bought by
Equity Trust Co Custodian Fbo Kirkover
Purchase Details
Closed on
May 21, 2013
Sold by
Us Bank National Assn
Bought by
Hogar Community Reinvestments Five Llc
Purchase Details
Closed on
Dec 10, 2012
Sold by
Shelborne Thad L
Bought by
Us Bank Na
Purchase Details
Closed on
Jul 20, 2001
Sold by
Blevins Thomas J
Bought by
Shelborne Thad L
Purchase Details
Closed on
Sep 12, 1990
Bought by
Blevins Thomas J
Purchase Details
Closed on
Jul 25, 1990
Create a Home Valuation Report for This Property
The Home Valuation Report is an in-depth analysis detailing your home's value as well as a comparison with similar homes in the area
Home Values in the Area
Average Home Value in this Area
Purchase History
| Date | Buyer | Sale Price | Title Company |
|---|---|---|---|
| Genesis Management Group Llc | $13,500 | Apex Title Agency Ltd | |
| Equity Trust Co Custodian Fbo Kirkover | $5,000 | Attorney | |
| Hogar Community Reinvestments Five Llc | -- | None Available | |
| Us Bank Na | $32,000 | None Available | |
| Shelborne Thad L | $24,500 | -- | |
| Blevins Thomas J | $25,000 | -- | |
| -- | -- | -- |
Source: Public Records
Tax History Compared to Growth
Tax History
| Year | Tax Paid | Tax Assessment Tax Assessment Total Assessment is a certain percentage of the fair market value that is determined by local assessors to be the total taxable value of land and additions on the property. | Land | Improvement |
|---|---|---|---|---|
| 2024 | $6,274 | $49,850 | $8,580 | $41,270 |
| 2023 | $2,714 | $49,840 | $8,575 | $41,265 |
| 2022 | $3,559 | $20,410 | $3,150 | $17,260 |
| 2021 | $1,412 | $20,410 | $3,150 | $17,260 |
| 2020 | $775 | $11,730 | $3,150 | $8,580 |
| 2019 | $733 | $9,380 | $2,520 | $6,860 |
| 2018 | $676 | $9,380 | $2,520 | $6,860 |
| 2017 | $661 | $9,380 | $2,520 | $6,860 |
| 2016 | $662 | $9,740 | $2,490 | $7,250 |
| 2015 | $636 | $9,740 | $2,490 | $7,250 |
| 2014 | $604 | $9,740 | $2,490 | $7,250 |
| 2013 | $546 | $17,850 | $2,940 | $14,910 |
Source: Public Records
Map
Nearby Homes
- 782 Berkeley Rd
- 768 Berkeley Rd
- 780-782 Seymour Ave
- 756 Seymour Ave
- 736-738 Lilley Ave
- 831 Lilley Ave Unit 833
- 812 Kelton Ave Unit 814
- 764-766 Kelton Ave
- 711 Seymour Ave
- 707 Seymour Ave
- 688 Berkeley Rd
- 941 Seymour Ave
- 693 Kelton Ave
- 1390 E Livingston Ave
- 971 Fairwood Ave
- 889 Kelton Ave
- 751 Bulen Ave
- 778 Miller Ave
- 810 Miller Ave
- 730 Miller Ave
- 1563 Gault St Unit 565
- 1553 Gault St Unit 555
- 1573 Gault St
- 812 Berkeley Rd
- 816 Berkeley Rd
- 792 Berkeley Rd
- 804 Berkeley Rd Unit 808
- 822 Berkeley Rd
- 788 Berkeley Rd
- 824 Berkeley Rd Unit 826
- 1566 Newton St
- 1574 Gault St
- 1570 Newton St
- 815 Seymour Ave Unit 817
- 811 Seymour Ave
- 821 Seymour Ave Unit 823
- 778 Berkeley Rd
- 830 Berkeley Rd Unit 36
- 830 Berkeley Rd
- 799 Seymour Ave Unit 801