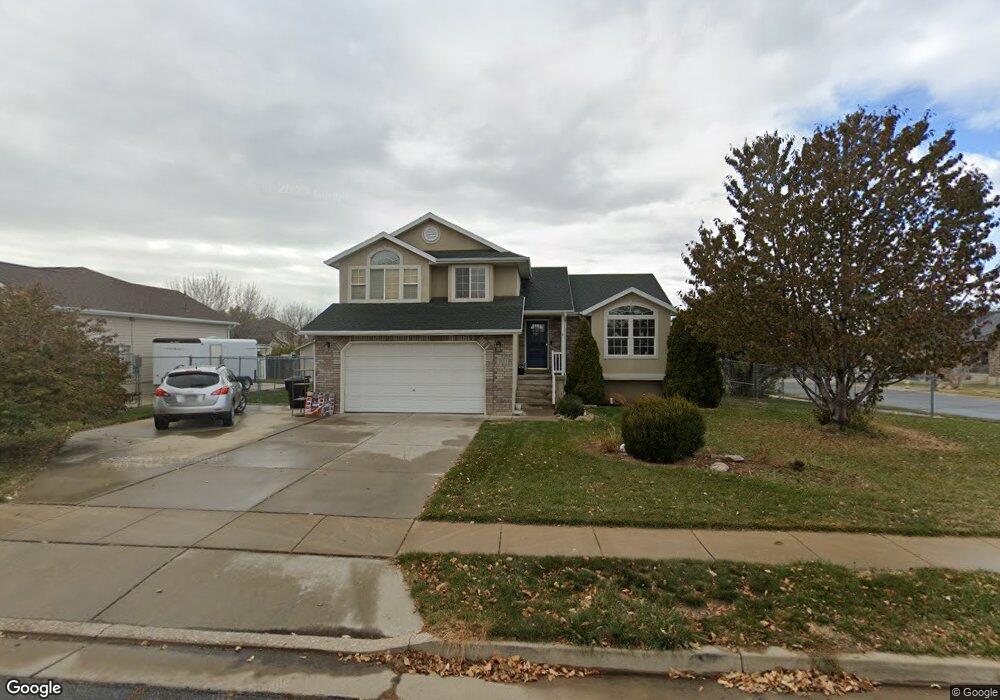
1563 N 1225 W Clearfield, UT 84015
Estimated Value: $551,000 - $636,000
4
Beds
3
Baths
2,254
Sq Ft
$267/Sq Ft
Est. Value
About This Home
This home is located at 1563 N 1225 W, Clearfield, UT 84015 and is currently estimated at $601,718, approximately $266 per square foot. 1563 N 1225 W is a home located in Davis County with nearby schools including Clinton Elementary School, Sunset Junior High School, and Clearfield High School.
Ownership History
Date
Name
Owned For
Owner Type
Purchase Details
Closed on
Jan 23, 2022
Sold by
Calton Robert R
Bought by
Bob And Debbie Calton Living Trust
Current Estimated Value
Purchase Details
Closed on
Mar 7, 2016
Sold by
Shultz Nathan D
Bought by
Calton Robert R
Purchase Details
Closed on
Feb 28, 2008
Sold by
Mike Schultz Construction Inc
Bought by
Shulz Nathan David
Home Financials for this Owner
Home Financials are based on the most recent Mortgage that was taken out on this home.
Original Mortgage
$245,500
Interest Rate
5.64%
Mortgage Type
Purchase Money Mortgage
Purchase Details
Closed on
Feb 28, 2006
Sold by
Alan Co Llc
Bought by
Mike Schultz Construction Inc
Home Financials for this Owner
Home Financials are based on the most recent Mortgage that was taken out on this home.
Original Mortgage
$1,945,187
Interest Rate
6.08%
Mortgage Type
Purchase Money Mortgage
Create a Home Valuation Report for This Property
The Home Valuation Report is an in-depth analysis detailing your home's value as well as a comparison with similar homes in the area
Home Values in the Area
Average Home Value in this Area
Purchase History
| Date | Buyer | Sale Price | Title Company |
|---|---|---|---|
| Bob And Debbie Calton Living Trust | -- | -- | |
| Calton Robert R | -- | Mountain View Title | |
| Shulz Nathan David | -- | Heritage West Title Ins Agen | |
| Mike Schultz Construction Inc | -- | Founders Title Co |
Source: Public Records
Mortgage History
| Date | Status | Borrower | Loan Amount |
|---|---|---|---|
| Previous Owner | Shulz Nathan David | $245,500 | |
| Previous Owner | Mike Schultz Construction Inc | $1,945,187 |
Source: Public Records
Tax History Compared to Growth
Tax History
| Year | Tax Paid | Tax Assessment Tax Assessment Total Assessment is a certain percentage of the fair market value that is determined by local assessors to be the total taxable value of land and additions on the property. | Land | Improvement |
|---|---|---|---|---|
| 2025 | $3,346 | $322,850 | $116,172 | $206,678 |
| 2024 | $3,165 | $307,450 | $93,716 | $213,734 |
| 2023 | $3,051 | $540,000 | $130,715 | $409,285 |
| 2022 | $3,282 | $318,450 | $75,567 | $242,883 |
| 2021 | $2,823 | $424,000 | $111,404 | $312,596 |
| 2020 | $2,565 | $373,000 | $98,229 | $274,771 |
| 2019 | $2,466 | $354,000 | $94,569 | $259,431 |
| 2018 | $2,344 | $334,000 | $92,108 | $241,892 |
| 2016 | $2,115 | $158,070 | $35,406 | $122,664 |
| 2015 | $2,091 | $148,830 | $35,406 | $113,424 |
| 2014 | $2,091 | $151,678 | $35,406 | $116,272 |
| 2013 | -- | $139,736 | $32,985 | $106,751 |
Source: Public Records
Map
Nearby Homes