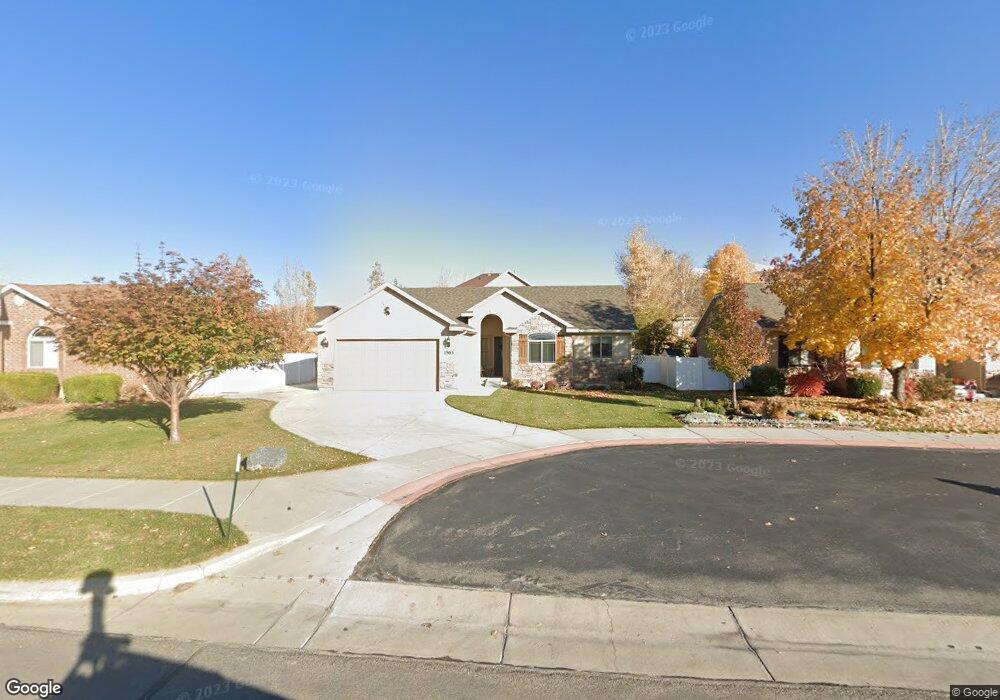
1563 S 930 W Payson, UT 84651
Estimated Value: $477,000 - $504,000
3
Beds
2
Baths
2,684
Sq Ft
$183/Sq Ft
Est. Value
About This Home
This home is located at 1563 S 930 W, Payson, UT 84651 and is currently estimated at $491,774, approximately $183 per square foot. 1563 S 930 W is a home located in Utah County with nearby schools including Spring Lake Elementary, Payson Junior High School, and Payson High School.
Ownership History
Date
Name
Owned For
Owner Type
Purchase Details
Closed on
Aug 15, 2021
Sold by
Sudweeks Kent and Sudweeks Brenda B
Bought by
Sudweeks Kent and Sudweeks Brenda
Current Estimated Value
Purchase Details
Closed on
Oct 27, 2006
Sold by
Baguley Glenn S
Bought by
Sudweeks Kent and Sudweeks Brenda B
Home Financials for this Owner
Home Financials are based on the most recent Mortgage that was taken out on this home.
Original Mortgage
$75,000
Outstanding Balance
$43,509
Interest Rate
5.87%
Mortgage Type
Purchase Money Mortgage
Estimated Equity
$448,266
Purchase Details
Closed on
Dec 1, 2004
Sold by
Zions Builders Inc
Bought by
Baguley Glenn S
Home Financials for this Owner
Home Financials are based on the most recent Mortgage that was taken out on this home.
Original Mortgage
$140,608
Interest Rate
5.65%
Mortgage Type
New Conventional
Create a Home Valuation Report for This Property
The Home Valuation Report is an in-depth analysis detailing your home's value as well as a comparison with similar homes in the area
Home Values in the Area
Average Home Value in this Area
Purchase History
| Date | Buyer | Sale Price | Title Company |
|---|---|---|---|
| Sudweeks Kent | -- | Noen | |
| Sudweeks Kent | -- | Inwest Title Services Inc | |
| Baguley Glenn S | -- | Horizon Title Insurance |
Source: Public Records
Mortgage History
| Date | Status | Borrower | Loan Amount |
|---|---|---|---|
| Open | Sudweeks Kent | $75,000 | |
| Previous Owner | Baguley Glenn S | $140,608 | |
| Closed | Baguley Glenn S | $35,152 |
Source: Public Records
Tax History
| Year | Tax Paid | Tax Assessment Tax Assessment Total Assessment is a certain percentage of the fair market value that is determined by local assessors to be the total taxable value of land and additions on the property. | Land | Improvement |
|---|---|---|---|---|
| 2025 | $2,293 | $251,020 | -- | -- |
| 2024 | $2,293 | $233,365 | $0 | $0 |
| 2023 | $2,322 | $236,940 | $0 | $0 |
| 2022 | $2,380 | $238,920 | $0 | $0 |
| 2021 | $2,013 | $324,100 | $109,100 | $215,000 |
| 2020 | $1,908 | $300,500 | $99,200 | $201,300 |
| 2019 | $1,755 | $283,400 | $82,100 | $201,300 |
| 2018 | $1,604 | $249,600 | $71,800 | $177,800 |
| 2017 | $1,486 | $124,355 | $0 | $0 |
| 2016 | $1,411 | $117,370 | $0 | $0 |
| 2015 | $1,316 | $108,680 | $0 | $0 |
| 2014 | $1,158 | $96,305 | $0 | $0 |
Source: Public Records
Map
Nearby Homes
- 1589 S 840 W
- 1468 S 910 W
- 802 Brookside Ct
- 1733 S 1100 W
- 1631 S Highway 198
- 1763 S 1100 W Unit 14
- 613 Saddlebrook Dr
- 1338 S 1050 W
- 609 W Saddlebrook Dr
- 1333 S 1050 W
- 1320 S 950 W
- 2003 S 1150 W Unit 1040
- 1116 W 1290 S
- 1146 W 1260 S
- 1172 S 880 W
- 1216 S 1150 W Unit 19
- 1163 S 730 W
- 1128 W 1150 S Unit 9
- 1835 S 410 W
- 1192 W 1130 St S Unit 202
- 1569 S 930 W
- 1569 S 930 W Unit 266
- 1553 S 930 St W
- 921 W 1550 S
- 921 W 1550 S Unit 264
- 1562 S 910 W Unit 276
- 1552 S 910 W
- 1568 S 910 W
- 1575 S 930 W
- 1575 S 930 W Unit 267
- 1574 S 910 W
- 1574 S 910 W Unit 274
- 1581 S 930 W
- 1581 S 930 W Unit 268
- 924 W 1550 S
- 924 W 1550 S Unit 212
- 1580 S 910 W
- 1580 S 910 W Unit 273
- 918 W 1550 S
- 918 W 1550 S Unit 213
Your Personal Tour Guide
Ask me questions while you tour the home.