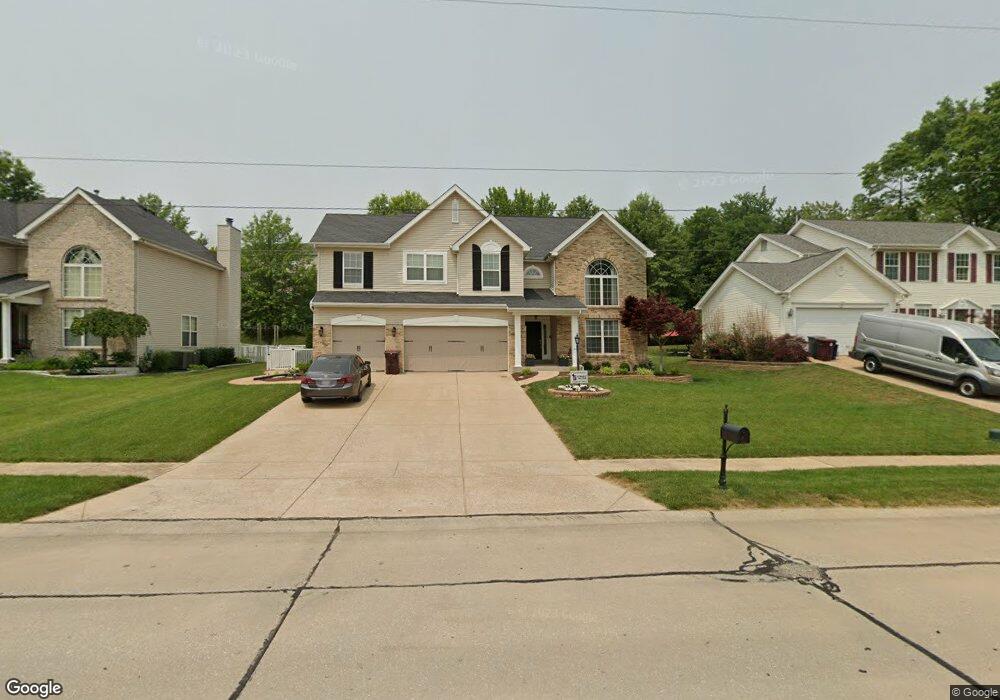
1563 Uthoff Dr Fenton, MO 63026
Estimated Value: $603,180 - $779,000
4
Beds
4
Baths
3,147
Sq Ft
$212/Sq Ft
Est. Value
About This Home
This home is located at 1563 Uthoff Dr, Fenton, MO 63026 and is currently estimated at $665,795, approximately $211 per square foot. 1563 Uthoff Dr is a home located in St. Louis County with nearby schools including Uthoff Valley Elementary School, Rockwood South Middle School, and Rockwood Summit Senior High School.
Ownership History
Date
Name
Owned For
Owner Type
Purchase Details
Closed on
Nov 18, 2021
Sold by
Peeples Ricky A and Revo Julie
Bought by
Ricky A Peeples And Julie A Peeples Revocable and Pe Julie
Current Estimated Value
Home Financials for this Owner
Home Financials are based on the most recent Mortgage that was taken out on this home.
Original Mortgage
$365,146
Outstanding Balance
$334,871
Interest Rate
3.05%
Mortgage Type
New Conventional
Estimated Equity
$330,924
Purchase Details
Closed on
Sep 27, 2011
Sold by
Peeples Ricky A and Peeples Julie A
Bought by
Peeples Ricky A and Revoca Julie A Peeples
Purchase Details
Closed on
Nov 12, 1998
Sold by
D R Horton Inc
Bought by
Peeples Ricky and Peeples Julie A
Home Financials for this Owner
Home Financials are based on the most recent Mortgage that was taken out on this home.
Original Mortgage
$224,200
Interest Rate
6.55%
Create a Home Valuation Report for This Property
The Home Valuation Report is an in-depth analysis detailing your home's value as well as a comparison with similar homes in the area
Home Values in the Area
Average Home Value in this Area
Purchase History
| Date | Buyer | Sale Price | Title Company |
|---|---|---|---|
| Ricky A Peeples And Julie A Peeples Revocable | -- | New Title Company Name | |
| Peeples Ricky A | -- | None Available | |
| Peeples Ricky | $236,000 | -- |
Source: Public Records
Mortgage History
| Date | Status | Borrower | Loan Amount |
|---|---|---|---|
| Open | Ricky A Peeples And Julie A Peeples Revocable | $365,146 | |
| Previous Owner | Peeples Ricky | $224,200 |
Source: Public Records
Tax History Compared to Growth
Tax History
| Year | Tax Paid | Tax Assessment Tax Assessment Total Assessment is a certain percentage of the fair market value that is determined by local assessors to be the total taxable value of land and additions on the property. | Land | Improvement |
|---|---|---|---|---|
| 2025 | $7,487 | $107,230 | $27,850 | $79,380 |
| 2024 | $7,487 | $101,080 | $20,900 | $80,180 |
| 2023 | $7,480 | $101,080 | $20,900 | $80,180 |
| 2022 | $7,312 | $92,090 | $13,050 | $79,040 |
| 2021 | $7,255 | $92,090 | $13,050 | $79,040 |
| 2020 | $6,748 | $82,350 | $13,950 | $68,400 |
| 2019 | $6,768 | $82,350 | $13,950 | $68,400 |
| 2018 | $6,813 | $79,550 | $17,400 | $62,150 |
| 2017 | $6,758 | $79,550 | $17,400 | $62,150 |
| 2016 | $5,382 | $63,990 | $17,400 | $46,590 |
| 2015 | $5,272 | $63,990 | $17,400 | $46,590 |
| 2014 | $5,442 | $64,420 | $11,120 | $53,300 |
Source: Public Records
Map
Nearby Homes
- 1575 Uthoff Dr
- 1107 Coronita Way
- 1808 Dover Trace Dr
- 1710 Stemwood Way
- 1702 Stemwood Way
- 1823 Dover Trace Dr
- 1719 Chestnut Farms Ct
- 928 Marshall Rd
- 82 May Valley Ln
- 300 Imperial Ln
- 732 Deer Vue Ln
- 627 Benton St
- 826 Vest Ave
- 2017 Brutus Ct
- 627 Vest Ave
- 683 Greenholme Ct
- 1655 Valley Park Rd
- 425 Benton St
- 678 Greensleeves Dr
- 530 Leonard Ave
- 1551 Uthoff Dr
- 1539 Uthoff Dr
- 1625 Uthoff Dr
- 1524 Bent Tree Trails Ct
- 1527 Uthoff Dr
- 1518 Bent Tree Trails Ct
- 1537 Bent Tree Trails Ct
- 1635 Uthoff Dr
- 1620 Uthoff Dr
- 1515 Uthoff Dr
- 1512 Bent Tree Trails Ct
- 1531 Bent Tree Trails Ct
- 1503 Uthoff Dr
- 1525 Bent Tree Trails Ct
- 1506 Bent Tree Trails Ct
- 1519 Bent Tree Trails Ct
- 1640 Uthoff Dr
- 1513 Bent Tree Trails Ct
- 1645 Uthoff Dr
- 1115 Bent Tree Trails Dr