15638 Haleys Landing Ln Houston, TX 77095
Estimated Value: $286,000 - $304,000
4
Beds
3
Baths
2,191
Sq Ft
$136/Sq Ft
Est. Value
About This Home
This home is located at 15638 Haleys Landing Ln, Houston, TX 77095 and is currently estimated at $296,975, approximately $135 per square foot. 15638 Haleys Landing Ln is a home located in Harris County with nearby schools including Fiest Elementary School, Labay Middle School, and Cypress Falls High School.
Ownership History
Date
Name
Owned For
Owner Type
Purchase Details
Closed on
Oct 2, 2014
Sold by
Desai Nirali
Bought by
Onyeocha Sandra
Current Estimated Value
Purchase Details
Closed on
Sep 5, 2006
Sold by
Household Finance Corp Iii
Bought by
Desai Nirali
Home Financials for this Owner
Home Financials are based on the most recent Mortgage that was taken out on this home.
Original Mortgage
$122,080
Interest Rate
6.55%
Mortgage Type
Purchase Money Mortgage
Purchase Details
Closed on
Mar 7, 2006
Sold by
Donaldson Cedrick and Donaldson Nicole
Bought by
Household Finance Corp Iii
Purchase Details
Closed on
Aug 13, 2004
Sold by
Kimball Hill Homes Houston Lp
Bought by
Donaldson Cedrick
Home Financials for this Owner
Home Financials are based on the most recent Mortgage that was taken out on this home.
Original Mortgage
$143,274
Interest Rate
7.15%
Mortgage Type
Purchase Money Mortgage
Create a Home Valuation Report for This Property
The Home Valuation Report is an in-depth analysis detailing your home's value as well as a comparison with similar homes in the area
Home Values in the Area
Average Home Value in this Area
Purchase History
| Date | Buyer | Sale Price | Title Company |
|---|---|---|---|
| Onyeocha Sandra | -- | Infinity Title Co | |
| Desai Nirali | -- | First American Title | |
| Household Finance Corp Iii | $151,580 | None Available | |
| Donaldson Cedrick | -- | Premier Title Co |
Source: Public Records
Mortgage History
| Date | Status | Borrower | Loan Amount |
|---|---|---|---|
| Previous Owner | Desai Nirali | $122,080 | |
| Previous Owner | Donaldson Cedrick | $143,274 |
Source: Public Records
Tax History Compared to Growth
Tax History
| Year | Tax Paid | Tax Assessment Tax Assessment Total Assessment is a certain percentage of the fair market value that is determined by local assessors to be the total taxable value of land and additions on the property. | Land | Improvement |
|---|---|---|---|---|
| 2025 | $4,144 | $291,149 | $59,442 | $231,707 |
| 2024 | $4,144 | $287,473 | $47,554 | $239,919 |
| 2023 | $4,144 | $266,052 | $47,554 | $218,498 |
| 2022 | $5,648 | $266,052 | $47,554 | $218,498 |
| 2021 | $5,361 | $222,395 | $47,554 | $174,841 |
| 2020 | $5,020 | $205,560 | $39,732 | $165,828 |
| 2019 | $4,729 | $200,920 | $27,531 | $173,389 |
| 2018 | $1,541 | $181,606 | $27,531 | $154,075 |
| 2017 | $3,954 | $150,000 | $27,531 | $122,469 |
| 2016 | $3,954 | $150,000 | $27,531 | $122,469 |
| 2015 | $3,137 | $173,185 | $27,531 | $145,654 |
| 2014 | $3,137 | $162,545 | $27,531 | $135,014 |
Source: Public Records
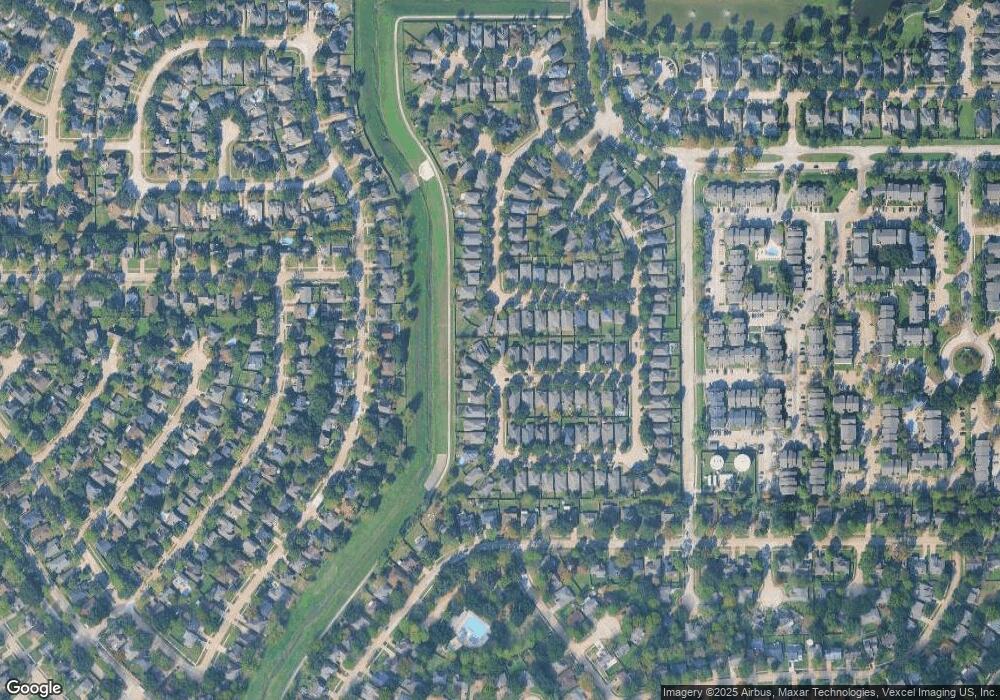
Map
Nearby Homes
- 15634 Haleys Landing Ln
- 15610 Tarpon Springs Ct
- 15610 Manorford Ct
- 15627 Kentwater Ct
- 8526 Greenleaf Lake Dr
- 15735 Jamie Lee Dr
- 15414 Swan Creek Dr
- 9303 Reston Grove Ln
- 15415 Swan Creek Dr
- 15611 Meadow Village Dr
- 15802 Aberdeen Trails Dr
- 15362 Meadow Village Dr
- 9111 Baber Dr
- 9119 Baber Dr
- 9111 Sunny Ridge Dr
- 15314 Tysor Park Ln
- 8818 Apple Mill Dr
- 9303 Rush Mill Ct
- 9307 Rush Mill Ct
- 15407 Copper Branch Ln
- 15642 Haleys Landing Ln
- 15639 Ashbournne Springs Ln
- 15639 Ashbournne Springs Ln
- 15630 Haleys Landing Ln
- 15643 Ashbournne Springs Ln
- 15635 Ashbournne Springs Ln
- 15635 Ashbournne Springs Ln
- 8931 Canton Park Ln
- 15639 Ashbourne Springs Ln
- 15631 Ashbournne Springs Ln
- 15626 Haleys Landing Ln
- 8927 Canton Park Ln
- 15629 Ashbournne Springs Ln
- 15635 Haleys Landing Ln
- 8923 Canton Park Ln
- 15622 Haleys Landing Ln
- 15631 Haleys Landing Ln
- 9007 Canton Park Ln
- 8919 Canton Park Ln
- 15627 Haleys Landing Ln