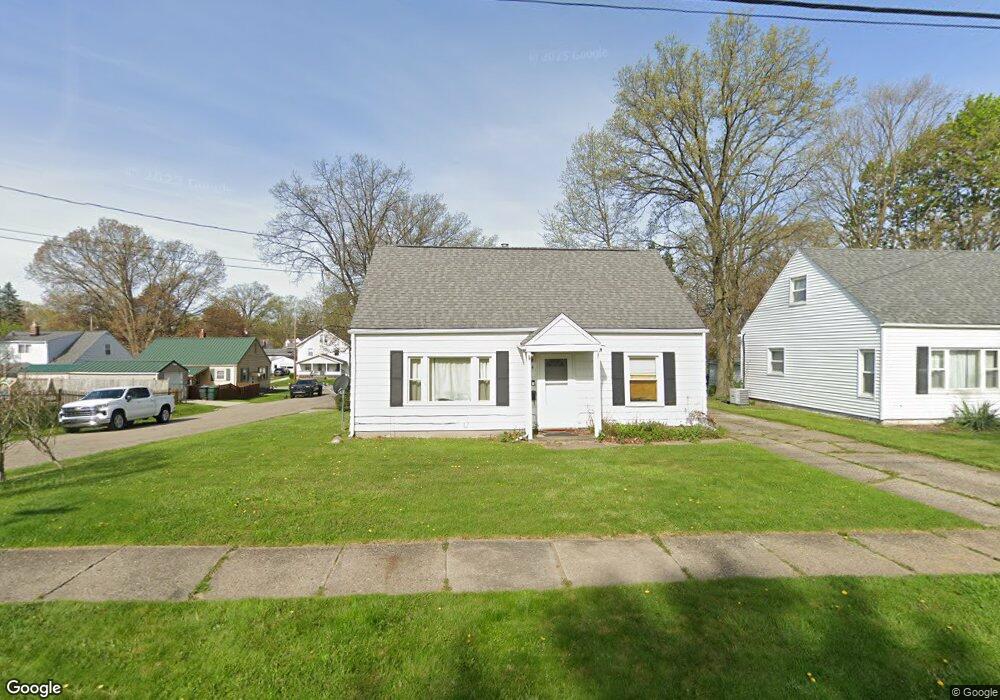
1564 11th St Cuyahoga Falls, OH 44221
Southeast Cuyahoga Falls NeighborhoodEstimated Value: $134,000 - $199,000
4
Beds
1
Bath
768
Sq Ft
$219/Sq Ft
Est. Value
About This Home
This home is located at 1564 11th St, Cuyahoga Falls, OH 44221 and is currently estimated at $168,562, approximately $219 per square foot. 1564 11th St is a home located in Summit County with nearby schools including Dewitt Elementary School, Bolich Middle School, and Cuyahoga Falls High School.
Ownership History
Date
Name
Owned For
Owner Type
Purchase Details
Closed on
Nov 1, 2013
Sold by
Sonnefeld Joseph R
Bought by
Antick Llc
Current Estimated Value
Home Financials for this Owner
Home Financials are based on the most recent Mortgage that was taken out on this home.
Original Mortgage
$50,050
Outstanding Balance
$37,340
Interest Rate
4.24%
Mortgage Type
Future Advance Clause Open End Mortgage
Estimated Equity
$131,222
Purchase Details
Closed on
Mar 29, 1999
Sold by
Hammond Richard N and Hammond Terri A
Bought by
Sonnefeld Joseph R
Create a Home Valuation Report for This Property
The Home Valuation Report is an in-depth analysis detailing your home's value as well as a comparison with similar homes in the area
Home Values in the Area
Average Home Value in this Area
Purchase History
| Date | Buyer | Sale Price | Title Company |
|---|---|---|---|
| Antick Llc | $57,500 | None Available | |
| Sonnefeld Joseph R | $32,000 | -- |
Source: Public Records
Mortgage History
| Date | Status | Borrower | Loan Amount |
|---|---|---|---|
| Open | Antick Llc | $50,050 |
Source: Public Records
Tax History Compared to Growth
Tax History
| Year | Tax Paid | Tax Assessment Tax Assessment Total Assessment is a certain percentage of the fair market value that is determined by local assessors to be the total taxable value of land and additions on the property. | Land | Improvement |
|---|---|---|---|---|
| 2025 | $2,369 | $42,907 | $13,031 | $29,876 |
| 2024 | $2,369 | $42,907 | $13,031 | $29,876 |
| 2023 | $2,369 | $42,907 | $13,031 | $29,876 |
| 2022 | $2,162 | $31,829 | $9,583 | $22,246 |
| 2021 | $2,162 | $31,829 | $9,583 | $22,246 |
| 2020 | $2,128 | $31,830 | $9,580 | $22,250 |
| 2019 | $1,777 | $24,220 | $9,100 | $15,120 |
| 2018 | $1,515 | $24,220 | $9,100 | $15,120 |
| 2017 | $1,374 | $24,220 | $9,100 | $15,120 |
| 2016 | $1,376 | $22,220 | $9,100 | $13,120 |
| 2015 | $1,374 | $22,220 | $9,100 | $13,120 |
| 2014 | $1,337 | $22,220 | $9,100 | $13,120 |
| 2013 | $1,735 | $28,280 | $9,100 | $19,180 |
Source: Public Records
Map
Nearby Homes