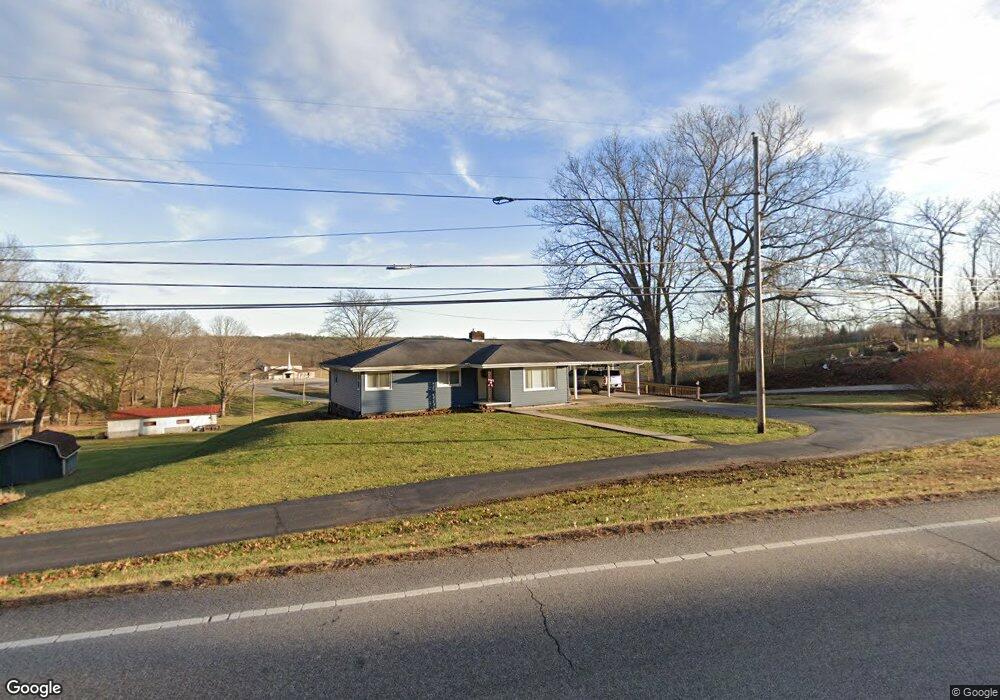
1564 Cove Rd Jackson, OH 45640
Estimated Value: $198,000 - $235,000
3
Beds
1
Bath
1,208
Sq Ft
$178/Sq Ft
Est. Value
About This Home
This home is located at 1564 Cove Rd, Jackson, OH 45640 and is currently estimated at $214,958, approximately $177 per square foot. 1564 Cove Rd is a home with nearby schools including Jackson High School.
Ownership History
Date
Name
Owned For
Owner Type
Purchase Details
Closed on
Jan 22, 2021
Sold by
Ousley Jo A and Sickles Jo A
Bought by
Sickles Jo A and Sickles Ronald
Current Estimated Value
Home Financials for this Owner
Home Financials are based on the most recent Mortgage that was taken out on this home.
Original Mortgage
$112,000
Outstanding Balance
$98,600
Interest Rate
2.6%
Mortgage Type
New Conventional
Estimated Equity
$116,358
Purchase Details
Closed on
Nov 28, 2016
Sold by
Compton Jimmy and Compton Connie
Bought by
Ousley Jo A
Home Financials for this Owner
Home Financials are based on the most recent Mortgage that was taken out on this home.
Original Mortgage
$111,111
Interest Rate
3.47%
Mortgage Type
New Conventional
Purchase Details
Closed on
Mar 18, 2014
Sold by
Adkins Gina Lee and Adkins Tina Dee
Bought by
Compton Jimmy and Compton Connie
Purchase Details
Closed on
Nov 29, 2000
Sold by
Compton Jimmy
Bought by
Adkins Gina Lee
Create a Home Valuation Report for This Property
The Home Valuation Report is an in-depth analysis detailing your home's value as well as a comparison with similar homes in the area
Purchase History
We collect this data history from publicly available records. To have your information removed, we recommend requesting removal directly through your county’s website.
| Date | Buyer | Sale Price | Title Company |
|---|---|---|---|
| Sickles Jo A | -- | Warranty Title Agency | |
| Sickles Jo A | -- | Warranty Title Agency | |
| Ousley Jo A | $110,000 | Priority National Title | |
| Ousley Jo A | $110,000 | Priority National Title | |
| Compton Jimmy | -- | None Available | |
| Compton Jimmy | -- | None Available | |
| Adkins Gina Lee | -- | -- | |
| Adkins Gina Lee | -- | -- |
Source: Public Records
Mortgage History
We collect this data history from publicly available records. To have your information removed, we recommend requesting removal directly through your county’s website.
| Date | Status | Borrower | Loan Amount |
|---|---|---|---|
| Open | Sickles Jo A | $112,000 | |
| Closed | Ousley Jo A | $111,111 |
Source: Public Records
Tax History
| Year | Tax Paid | Tax Assessment Tax Assessment Total Assessment is a certain percentage of the fair market value that is determined by local assessors to be the total taxable value of land and additions on the property. | Land | Improvement |
|---|---|---|---|---|
| 2025 | $1,895 | $50,970 | $14,120 | $36,850 |
| 2024 | $1,865 | $50,970 | $14,120 | $36,850 |
| 2023 | $1,898 | $50,970 | $14,120 | $36,850 |
| 2022 | $2,173 | $42,690 | $13,490 | $29,200 |
| 2021 | $1,736 | $42,690 | $13,490 | $29,200 |
| 2020 | $1,745 | $42,690 | $13,490 | $29,200 |
| 2019 | $1,546 | $37,120 | $11,730 | $25,390 |
| 2018 | $1,491 | $37,120 | $11,730 | $25,390 |
| 2017 | $1,414 | $37,120 | $11,730 | $25,390 |
| 2016 | $1,399 | $35,460 | $10,050 | $25,410 |
| 2015 | $1,407 | $35,460 | $10,050 | $25,410 |
| 2013 | $1,330 | $33,930 | $9,710 | $24,220 |
| 2012 | $1,349 | $33,930 | $9,710 | $24,220 |
Source: Public Records
Map
Nearby Homes
- 9805 Beaver Pike
- 816 Cove Rd
- 4359 Whaley Town Rd
- 1596 Buckeye Church Rd
- 1025 Limerick Rd
- 1033 Limerick Rd
- 1413 Harrison Rd
- 148 Limerick Rd
- 3385 Rd
- 3244 Township Highway 243
- 6269 Beaver Pike
- 216 Patrick Ave
- 0 5 Points Rd
- 0 Dutch Hollow Rd
- 7679 Ohio 335
- 0 E Side State Route 335
- Jisco Lodge Rd
- 10057 Ohio 776
- 14543 Beaver Pike
- 9459 State Route 335
- 1564 Cove Rd
- 1563 Cove Rd
- 1563 Cove Rd
- 9873 Beaver Pike
- 9874 Beaver Pike
- 9874 Beaver Pike
- 9842 Beaver Pike
- 10095 Beaver Pike
- 83 Jisco West Rd
- 9805 Beaver Pike
- 10086 Beaver Pike
- 92 Tope Rd
- 10190 Beaver Pike
- 10305 Beaver Pike
- 90 Tope Rd
- 9722 Beaver Pike
- 143 Tope Rd
- 9645 Beaver Pike
- 9654 Beaver Pike
- 344 Tope Rd
Your Personal Tour Guide
Ask me questions while you tour the home.